- Bitcoin could break above $10,000 in the next quarter.
- The upside sentiment matures as the S&P 500 hints at painting a super-bullish Golden Cross in July 2020.
- The U.S. benchmark’s growing correlation with Bitcoin could help it attempt a breakout towards $20,000.
As bitcoin repeatedly struggles to close above $10,000, the S&P 500 is paving the way for it venture into the six-figure region.
So it seems, the U.S. benchmark is on the verge of painting a so-called “Golden Cross” for the first time since March 2019. Its 50-day moving average (currently at 2,944.9) is currently trending towards its 200-day moving average (now at 3017.7), looking to crossover in the first week of July 2020.
SPX chart on TradingView.com hinting to form a Golden Cross pattern in July 2020. Source: TradingView.com
At current points, the 50-DMA is just 2.58 percent away from 200-DMA.
Golden Cross Fractals in S&P 500, Bitcoin
Investors/traders employ the golden cross strategy to secure bullish cues from a market. Their occurrence in the S&P 500 has mostly resulted in long-term uptrends. In 2019 and 2016, for instance, the index rose by as much as 20.79 percent and 40.56 percent, respectively.
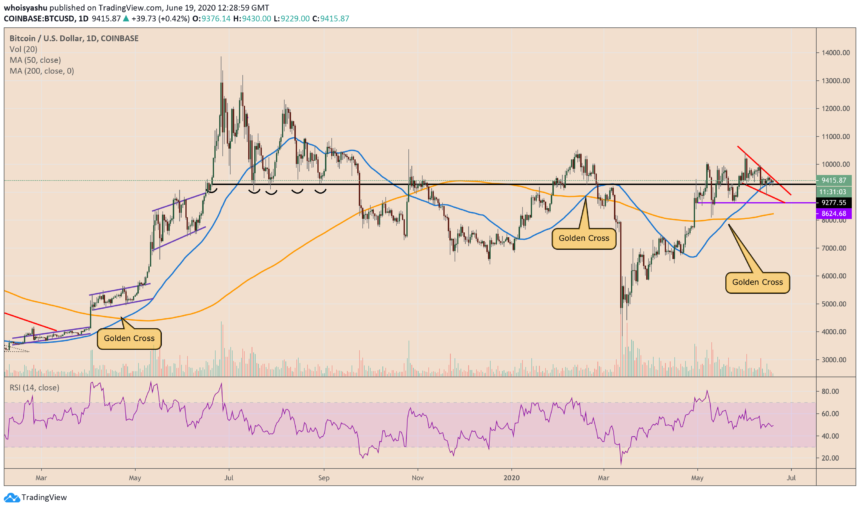
Golden Crosses gave Bitcoin similar bullish results, albeit with few exceptions. The cryptocurrency’s 50-200 DMA crossover in February 2020 surprised bulls by sending the price lower. Meanwhile, a similar occurrence in 2019 shot Bitcoin upwards by circa 161 percent.
Bitcoin price chart on TradingView.com showing its Golden Cross formations. Source: TradingView.com
Bitcoin is currently trending higher with part of its upside bias following the formation of a new Golden Cross on May 20, 2020.
All-Time Highs
The bullish crossover in the Bitcoin market followed a sharp, 100-percent recovery rally from its March lows. Meanwhile, the S&P 500 is looking to print the same pattern after it rallied by more than 40 percent from its March 23 price bottom.
What’s behind the rallies, nevertheless, is one expansionary central bank policy. The U.S. Federal Reserve has cut its benchmark rates to near zero – and it is buying trillions of dollars of Treasuries and corporate bonds to aid the economy through a global health crisis.
Fed’s chairman Jerome Powell says that his office would do everything they can to support the economy. The move has left risk-taking traders buoyed, which is reflective in the stock market rally since March 2020.
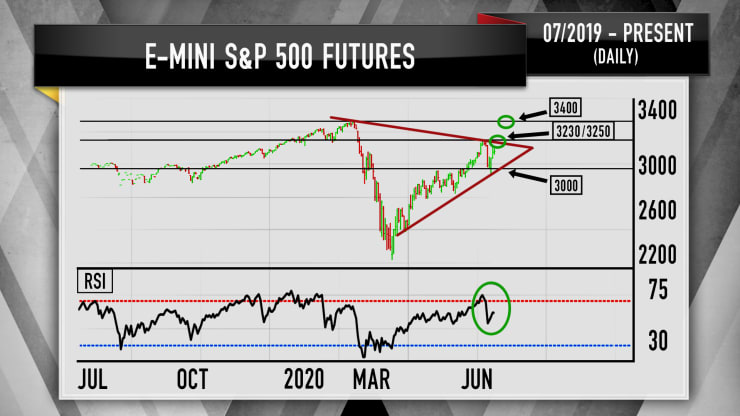
Carley Garner, a market strategist and author of “Higher Probability Commodity Trading, mapped out a case wherein she sees the S&P 500 breaking through its all-time high of 3,400.
S&P 500 futures hint at a breakout from an ascending triangle pattern. Source: Carley Garner
“Because the floor held, Garner’s betting the bulls will be in control going forward,” CNBC host Jim Cramer said. “As long as the S&P can stay above 3,000 lines, she thinks that that opens the door for a retest of the all-time highs near 3,400.”
Meanwhile, Bitcoin is testing a similar price floor in the $8,600-9,300 area – it is a broader range because of the cryptocurrency’s higher price volatility. Traders believe that cryptocurrency could attempt a bull run if it holds the support area and breaks above $10,000.
Bloomberg sees Bitcoin hitting $20,000 by the end of this year.


