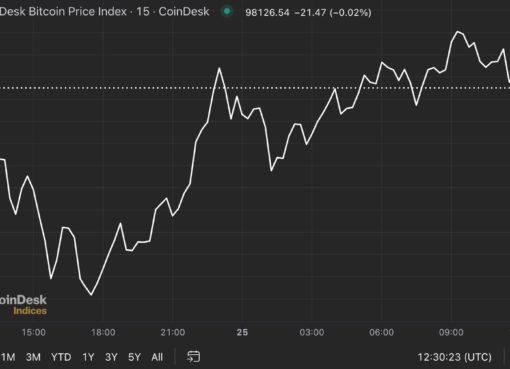
Total crypto market cap added $28 billion to its value for the period since Monday and now stands at $1.30 trillion. The top ten coins are all in green for the last 24 hours with Polkadot (DOT) being the best performing digital asset with a 4 percent of price increase. At the time of writing bitcoin (BTC) is trading at $31,750. Ether (ETH) is at $1,977.
BTC/USD
Bitcoin was using the zone above $31,000 as horizontal support for quite some time. On Sunday, July 18, it jumped up from that level to end the week at $31,700, but still failed to move above the $32,300 mark – the neckline of the big head and shoulders pattern on the weekly timeframe. BTC lost that important line, confirming the bearish pattern and erasing 7-percent of its value for the period.
On Monday, the coin dropped to $30,800, closing below $31,00 for the first time since January 27. The entire cryptocurrency market was bleeding with a lot of coins in the Top 100 registering double-digit losses.
The situation worsened on the next day when bitcoin fell further to $29,800 as many analysts were already pointing to $25,000 as the next zone of support followed by the previous bull market’s all-time high at $19,400.
The third day of the workweek was slightly better for buyers and the leading cryptocurrency climbed to $32,150 after rebounding from the mentioned lows, which resulted in a 7.7 percent increase. BTC was rejected at the 21-day EMA on the daily chart.
What we are seeing midday on Thursday is a slight pullback below the weekly open.
ETH/USD
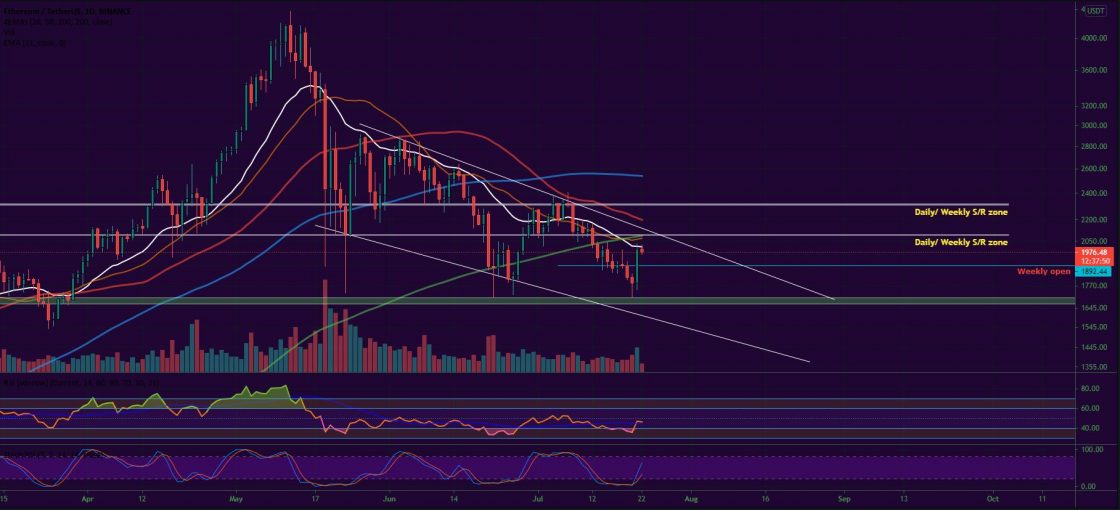
The Ethereum Project token ETH continued to be caught in a downtrend corridor, making lower highs and lower lows on the daily chart. On Sunday, July 18 it was rejected at the $2,000 mark – close to the 21-day EMA and fell down to $1,893 fully retracing its daily gains. The coin was 11.4 percent down for the seven-day period.
Looking at the weekly chart the ether is in quite a bad shape two weeks before the major network upgrade – the London hard fork, which is scheduled for August 4. The ETH/USDT pair moved below the stable support zone that was established in the $1,940-$1,980 range and broke below the Falling Wedge pattern, invalidating it.
On Monday, bears continued to be in charge pushing the price down by 3 more percent to $1,816.
The trading session on Tuesday was no different and the leading altcoin formed a candle to $1,780 – its lowest daily close since March 29. It is worth mentioning that during intraday, the ETH token was trading even lower – at $1,703 before bulls stepped in.
On Wednesday, July 21, we saw the so-called “relief bounce” as sell orders were absorbed to open space for an 11 percent increase session to $1,990.
On Thursday, the ETH/USDT pair is trading at $1,980, unable to surpass the 21-day EMA on the daily chart.
Like BTCMANAGER? Send us a tip!
Our Bitcoin Address: 3AbQrAyRsdM5NX5BQh8qWYePEpGjCYLCy4


