

Cardano’s price started a fresh decline below $0.250. ADA is testing important support at $0.2450 and might start a recovery wave.
- ADA price started a fresh decline below the $0.255 and $0.250 levels against the US dollar.
- The price is trading below $0.250 and the 100 simple moving average (4 hours).
- There is a key declining channel forming with resistance near $0.2480 on the 4-hour chart of the ADA/USD pair (data source from Kraken).
- The pair must stay above the $0.2420 support to start a fresh increase in the near term.
Cardano’s ADA Price Revisits Support
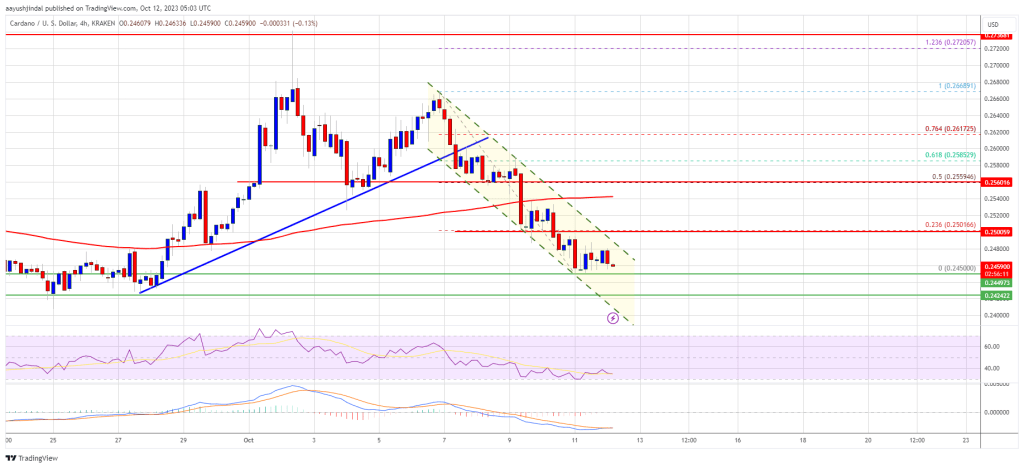
After a steady increase, Cardano failed to clear the $0.2650 resistance zone. The price formed a short-term top at $0.2668 and recently started a fresh decline, like Bitcoin and Ethereum.
There was a drop below the $0.255 support level. Besides, there was a break below a key bullish trend line with support near $0.259 on the 4-hour chart of the ADA/USD pair. The pair even declined below the $0.250 support and the 100 simple moving average (4 hours).
A low is formed near $0.2450 and the price is now consolidating losses. Cardano is now trading below $0.250 and the 100 simple moving average (4 hours). On the upside, immediate resistance is near the $0.248 zone.
There is also a key declining channel forming with resistance near $0.2480 on the 4-hour chart of the ADA/USD pair. The first resistance is near $0.250 or the 23.6% Fib retracement level of the downward move from the $0.2668 swing high to the $0.2450 low.
Source: ADAUSD on TradingView.com
The next key resistance might be $0.2560 and the 50% Fib retracement level of the downward move from the $0.2668 swing high to the $0.2450 low. If there is a close above the $0.256 resistance, the price could start a decent increase. In the stated case, the price could rise toward the $0.285 resistance zone.
More Losses in ADA?
If Cardano’s price fails to climb above the $0.250 resistance level, it could continue to move down. Immediate support on the downside is near the $0.245 level.
The next major support is near the $0.242 level. A downside break below the $0.242 level could open the doors for a sharp fresh decline toward $0.220. The next major support is near the $0.200 level.
Technical Indicators
4 hours MACD – The MACD for ADA/USD is losing momentum in the bearish zone.
4 hours RSI (Relative Strength Index) – The RSI for ADA/USD is now below the 50 level.
Major Support Levels – $0.245, $0.242, and $0.220.
Major Resistance Levels – $0.250, $0.255, and $0.285.
 Stock Lost 3% on Weak Second-Quarter California Deliveries")

