
In a recent tweet, renowned crypto analyst, EGRAG CRYPTO, unveiled an intricate 4-month XRP price analysis which presented various crucial insights and predictions. This was encapsulated in his words: “XRP Steel Foundation & Eye-Opening Insights: Behold the chart below, crafted from 4-month candles, revealing that higher time frames are less susceptible to deceptive signals.”
The Steel Foundation Of XRP
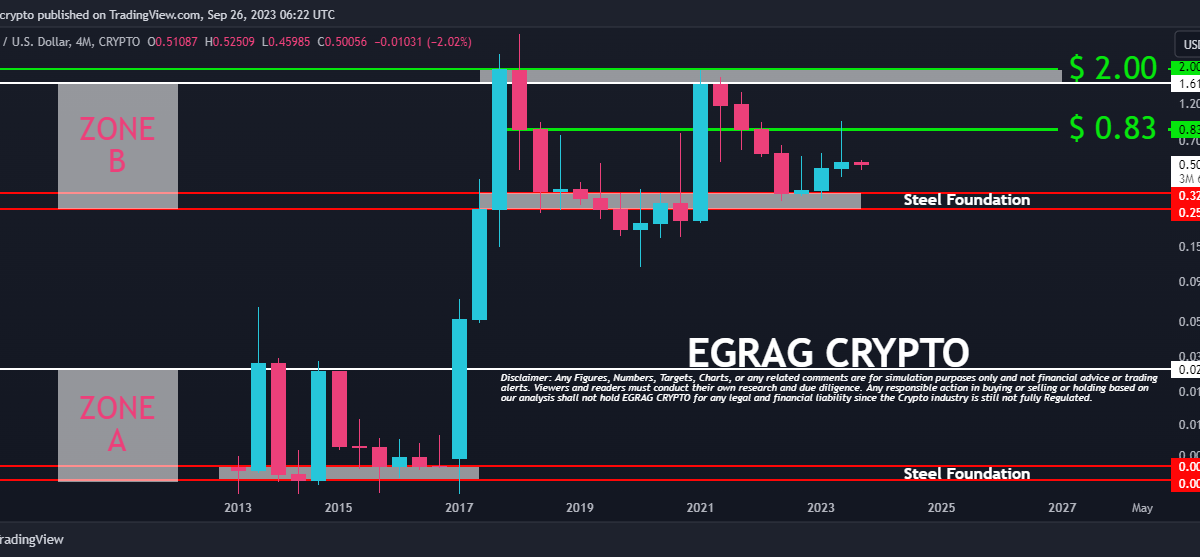
Egrag’s analysis draws attention to two major price zones, zone A and zone B, each with its own ultra-strong support zone which he metaphorically describes as the “steel foundation”.
For zone A, which saw XRP trading between $0.00485 to $0.02483 from 2013 until early 2017, the steel foundation is identified by him as the price range from $0.00485 to $0.00596. The significance of this foundation is amplified by the fact that it remained untouched even during the harshest market downturns.
On the other hand, zone B, with its price range spanning from $0.25939 to $2.00, is marked by a steel foundation between $0.25939 and $0.32630. This has acted as a robust support from 2017 onwards. However, the weight of a prolonged bear market combined with external factors like the SEC lawsuit did manage to push the price momentarily below this line.
A critical observation by Egrag is that the price, when plotted on a 4-month time frame, has never recorded a close above the $2.00 mark. Drawing from this observation, Egrag speculates that breaking past this resistance is essential for XRP to revisit its all-time high of $3.40, attained on January 7, 2018. For this feat to occur, the cryptocurrency would need a surge of more than 580% from its current pricing.
More Insights From The Crypto Analyst
Egrag further elaborated that in June 2022, September 2022, and January 2023, the bulls tried and succeeded in preventing the XRP price from breaching the steel foundation, portraying a highly bullish sentiment. Moreover, the chart underscores the $0.80-$0.85 range as a significant historical point of contention.
XRP has continually failed to close above this threshold, repeatedly showing red during bearish phases. “The chart unmistakably highlights the 0.80-0.85 cent range as a historical battleground. The cryptocurrency has never closed a full-bodied Green Candle above this threshold, perpetually donning a red shroud during the #Bear market descent,” Egrag stated.
Another notable prediction from Egrag is that the emergence of a monthly green candle closure above $0.83 will set the stage for the next steel foundation which he calls the “the imminent transformation”. In simpler terms, this might be the last opportunity for traders and investors to purchase the token under $1, according to him.
Lastly, Egrag warns of the potential FOMO (Fear of Missing Out) rush when XRP hits the $2 range, indicating this could be a crucial zone for traders. Concluding his analysis, EGRAG CRYPTO encouraged the XRP community to remain vigilant and informed, promising to provide further in-depth visuals and insights on longer timeframes, such as the ASO bullish cross.
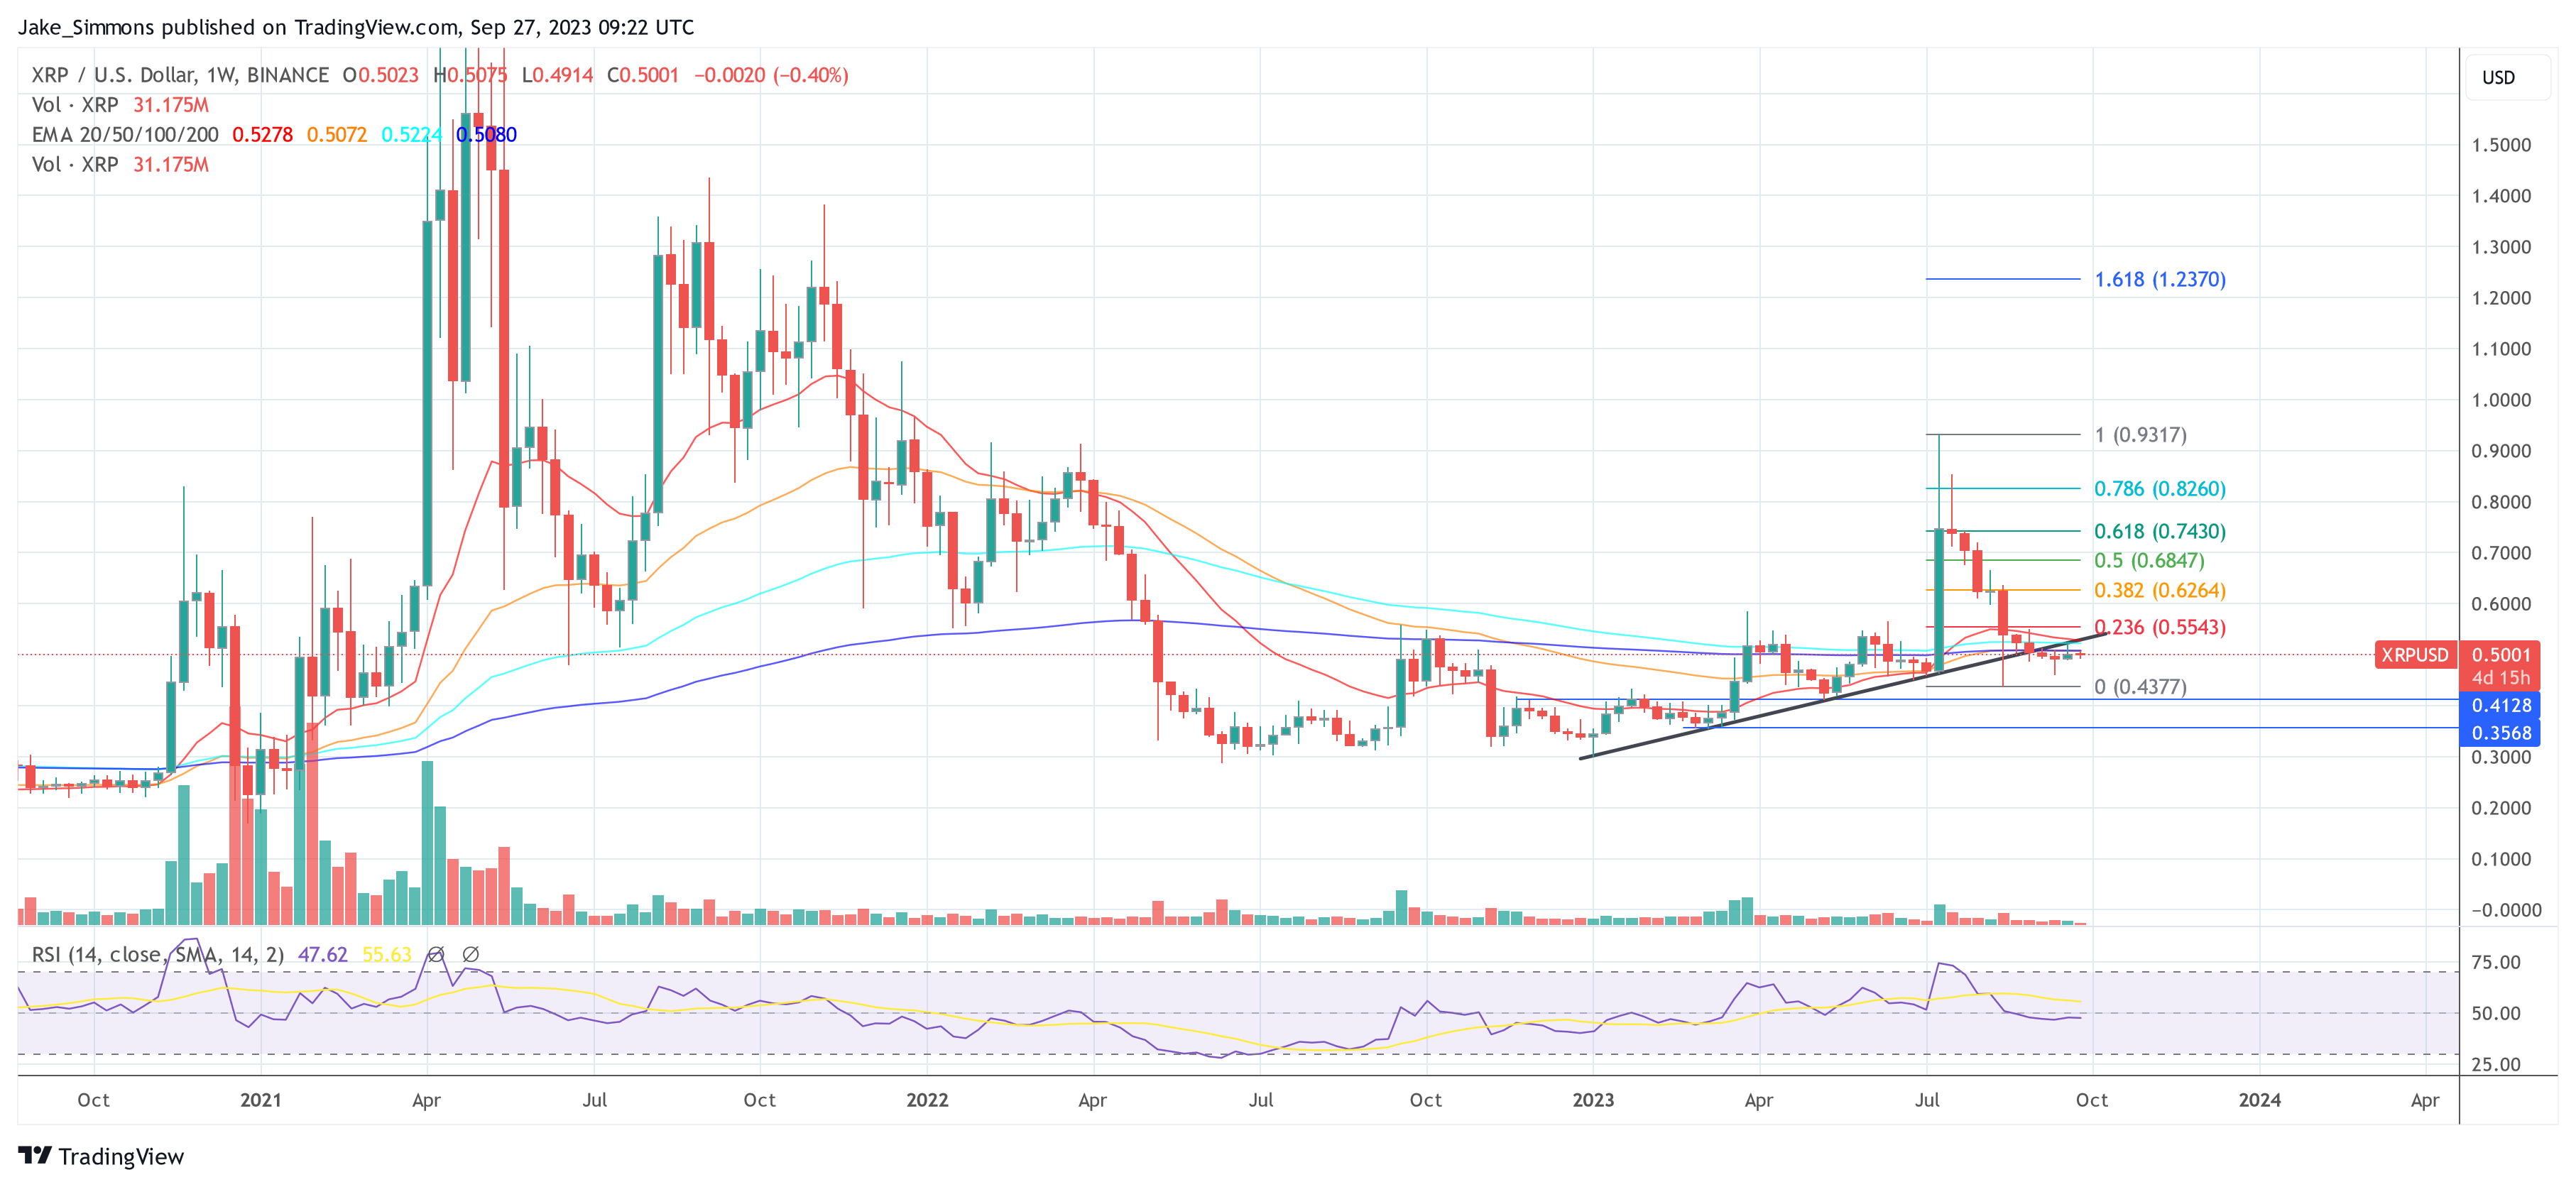
At press time, XRP traded at $0.5001.
Featured image from Shutterstock, chart from TradingView.com


