While Bakkt clients will be able to deposit their funds into the Bakkt Warehouse next week on Sept. 6, Bitcoin price is trending downwards after falling below $10,000 in the run-up to the event.
So is this already priced in or the market cycles are just repeating themselves? Let’s take a look at some key similarities to previous bull market cycles.
Similarities I & II: 100-week MA & 21-week EMA providing support
BTC/USD Weekly chart. Source: Tradingview
A common discussion lately on Crypto Twitter suggests that there’s a confluence between the so-called Bitcoin (BTC) price “bubble” top of 2017 and the last top at the end of July at $13,935. In a sense, parabolic movements tend to repeat the same stages over and over again. However, there are some substantial differences between them.
The top of 2017 came at the end of a market cycle, which essentially started with the confirmation of the 100-week Moving Average (MA) and 21-week Exponential Moving Average (EMA) during January 2016.
However, the top of July 2019 was essentially the first peak above the 100-week MA and did not face the euphoria comparable to the period in December 2017. So, are they comparable?
Basically, during the whole bull market of 2016–2017 there were several parabolic movements ending in a retracement.
The start of this was the period during Q4 2015 and the beginning of January 2016 through which Bitcoin price ended the bear market with a parabolic move and found support at the 100-week MA and 21-week EMA.
After this confirmation the market has seen several corrections of 30-40%, which are quite healthy for an upwards trending market.
With that in mind, it makes more sense to compare the previous parabolic movement towards the first parabolic movement coming out of the bear market in 2015, as that was the kickstart of a new cycle.
Relying on the chart, this could mean that Bitcoin price could face another test of the 100-week MA or the 21-week EMA to confirm the bullish perspective and face a period of accumulation prior to the halving event.
The past halving events on Litecoin and Bitcoin saw upwards price movements a few months prior to the actual event. If history repeats itself, we could see some upwards movements in Q1 of 2020.
Similarity III: 200-day Moving Average support
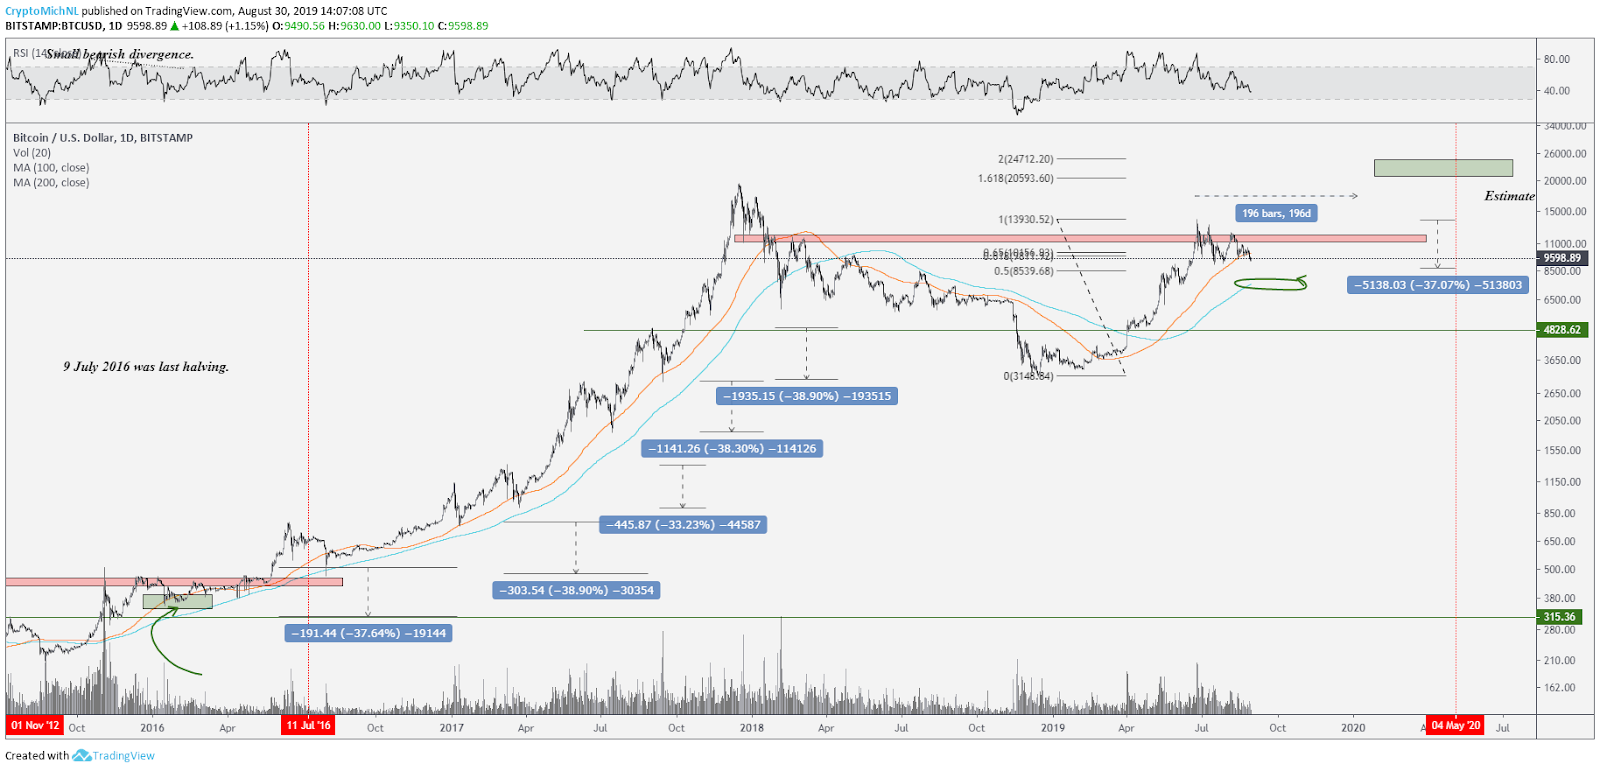
BTC/USD Daily chart. Source: Tradingview
Another indicator of a bullish market is the support of the 200-day MA. During the previous cycle, Bitcoin always found support on the 200-day MA and, during the later phases, also on the 100 MA, which is currently moving around $7,500.
Meanwhile, the latest BTC price drop below $10K means it just lost the 100 MA, which is comparable to the start of the last cycle in January 2016.
Similarity IV: Altcoins getting crushed
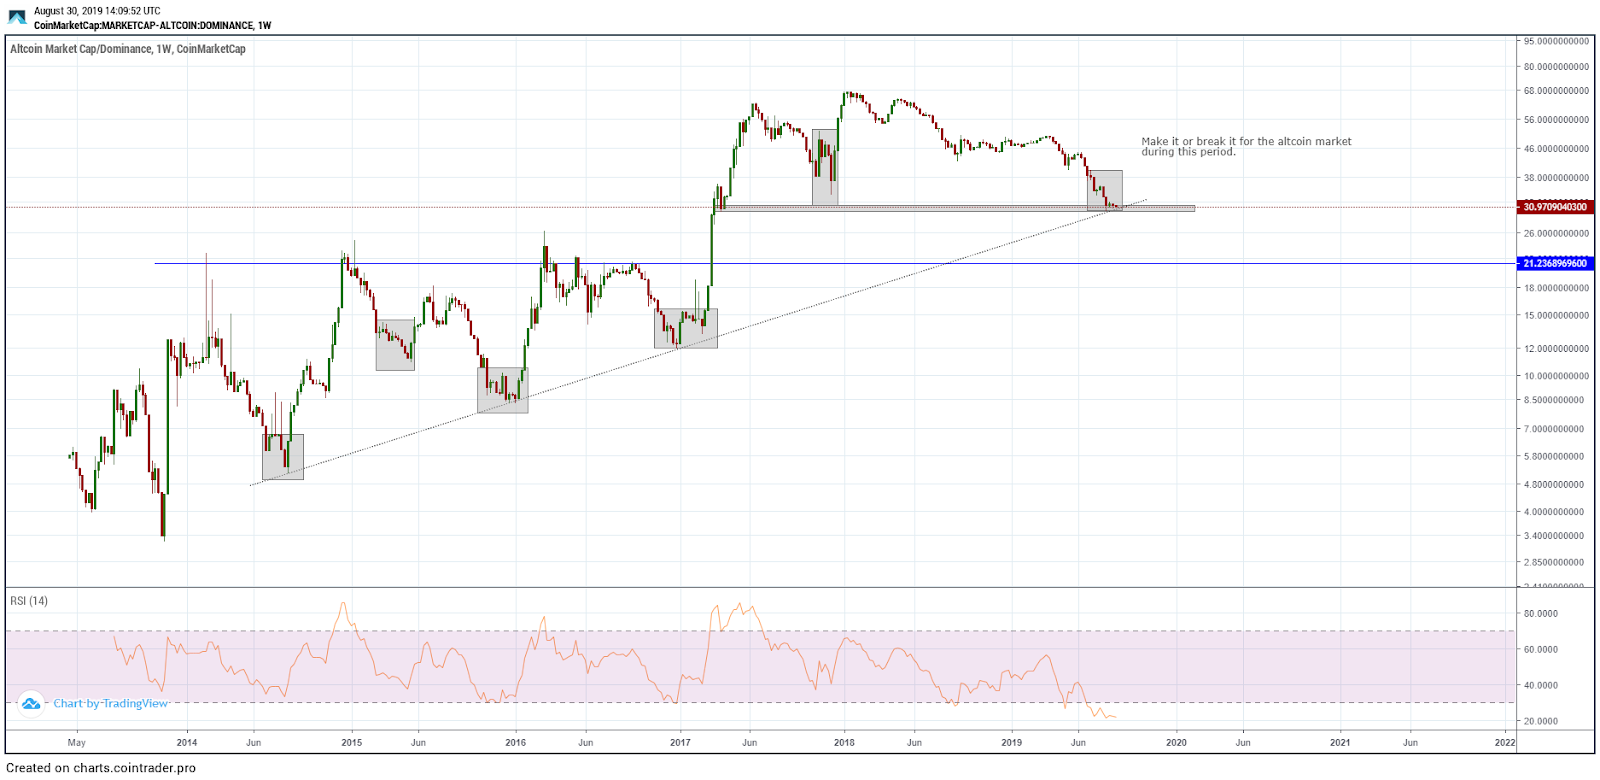
Altcoin dominance. Source: Cointrader
The last few months haven’t been good to altcoins. While Bitcoin price is moving upwards and continues to range, altcoin investors are punished more and more by the market.
This leads to the fear of buying altcoins and we are getting stuck in a vicious cycle. However, we have been here before.
Back in 2015 — while Bitcoin was moving from $196 to $505 — altcoins didn’t follow suit. Instead, they began to move when Bitcoin price bottomed out of its first parabolic run on January 15, 2016 (the touch of the 100-week MA and 21-week MA confirming the bottom).
If we take a look at an altcoin market cap dominance chart, it’s easy to see that it has retraced down to the lowest level in two years, while the RSI is showing a level of 22. This means that altcoins were being sold heavily during the past period.
Notably, a potential support level and a trendline are coming into play. Comparable to the beginning of 2016, in which the dominance of altcoins fell from 16% to 8% — this occurred prior to big upwards movements. For example, Ether (ETH) went up by 1700% in the months after, Vertcoin went up by 800%, etc.
Comparing these two analyses with the technical point of view of the market, it is to be expected that Bitcoin needs a natural period of accumulation, through which altcoins will eventually catch up and move alongside with BTC/USD.
To date, altcoins have been following Bitcoin (e.g. Bitcoin price all-time high in December 2017, altcoin all-time high in January/February 2018).
In other words, this leads me to believe that altcoins will start to move as soon as Bitcoin is ranging/bottomed out from this parabolic move.
Total market cap excluding BTC
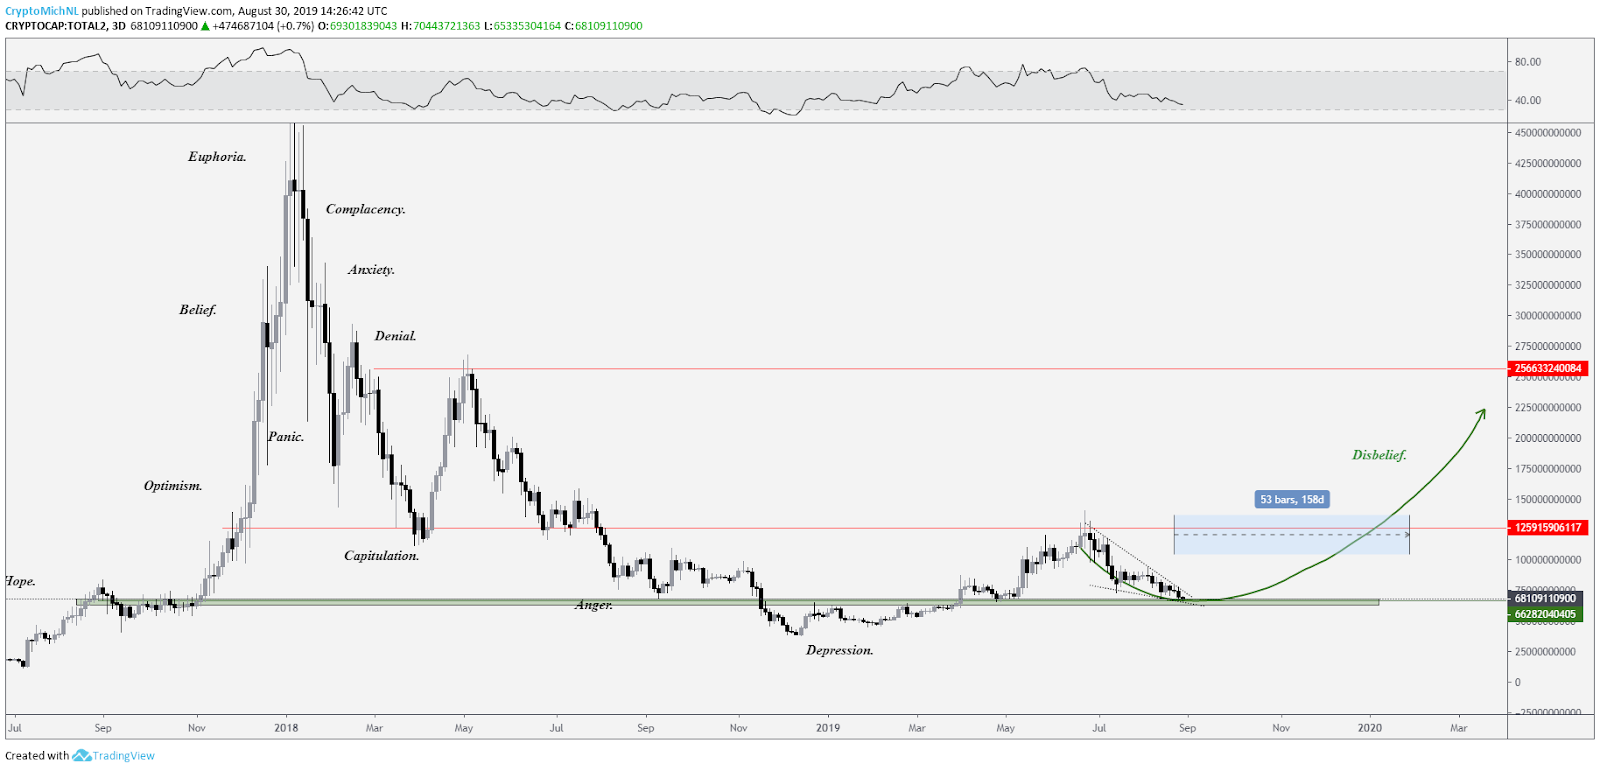
Total crypto market cap excluding Bitcoin. Source: Tradingview
The total market capitalization (excluding Bitcoin) has shown a move upwards to the $125 billion area of resistance, which acted as a support during 2018 and retraced down since then.
According to the chart, it’s currently testing an important level. If the market is able to find support here (at $62–66 billion), the old resistance of November/December 2018 will act as a support.
This will lead towards a new higher low, and potentially the disbelief phase and a new cycle. The current market capitalization of altcoins is $66 billion, which is equal to the market capitalization of altcoins in March 2019 when the price of Bitcoin was $4,000. Simply put, this is the ultimate carnage for altcoin holders.
What scenarios are there?
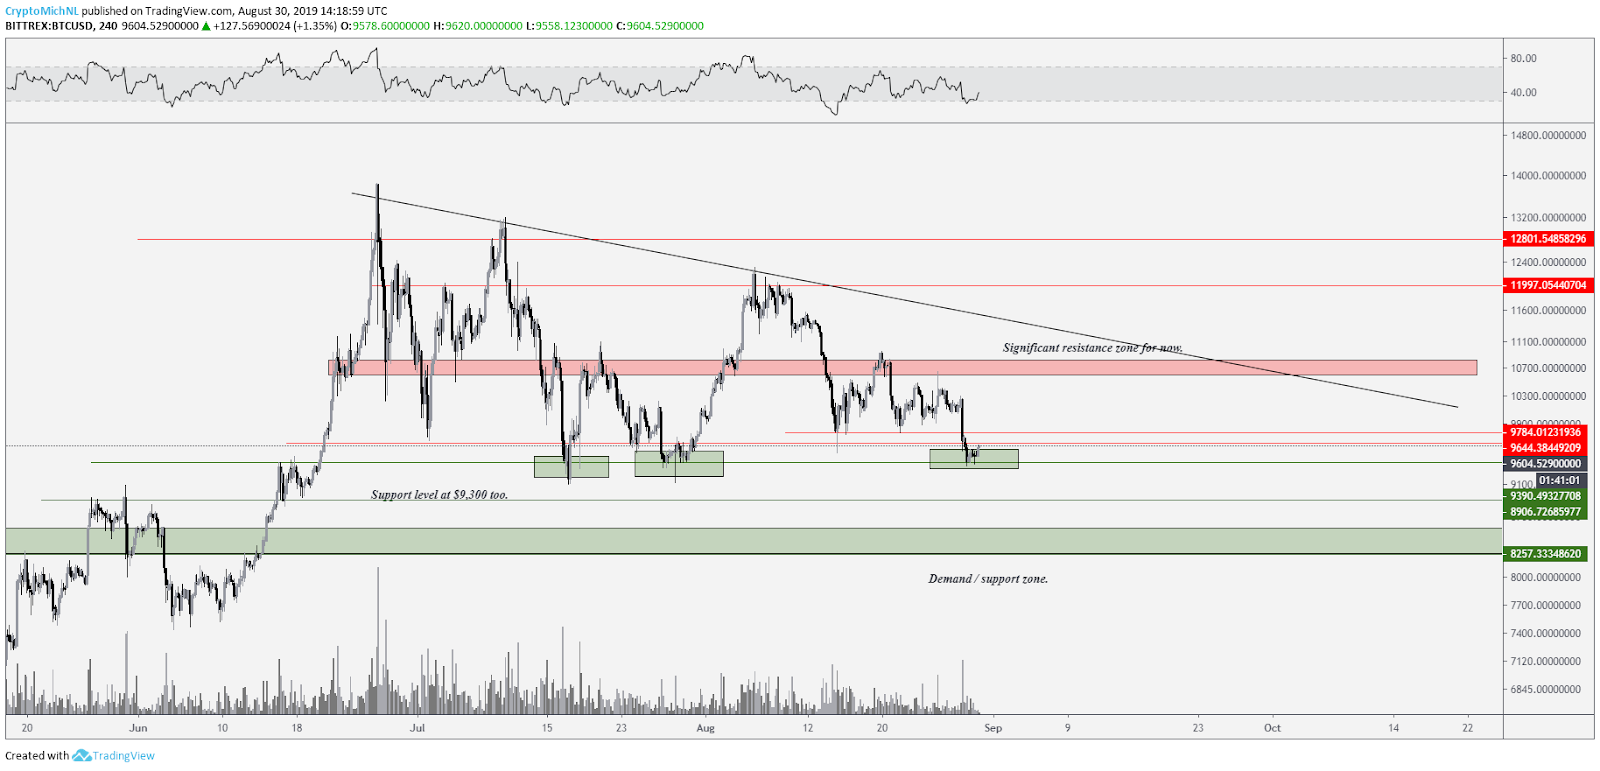
BTC/USD. Source: Tradingview
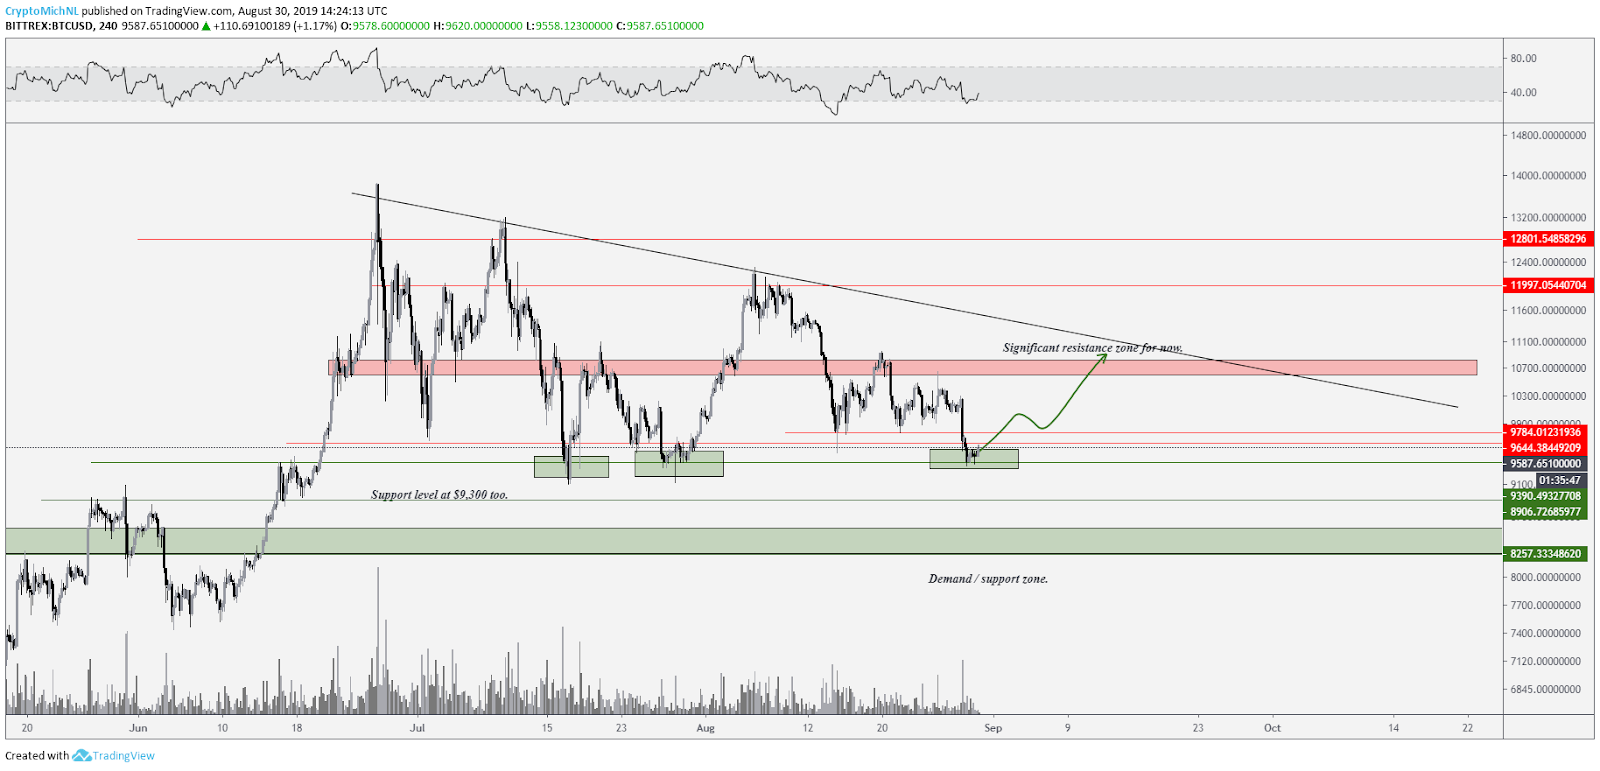
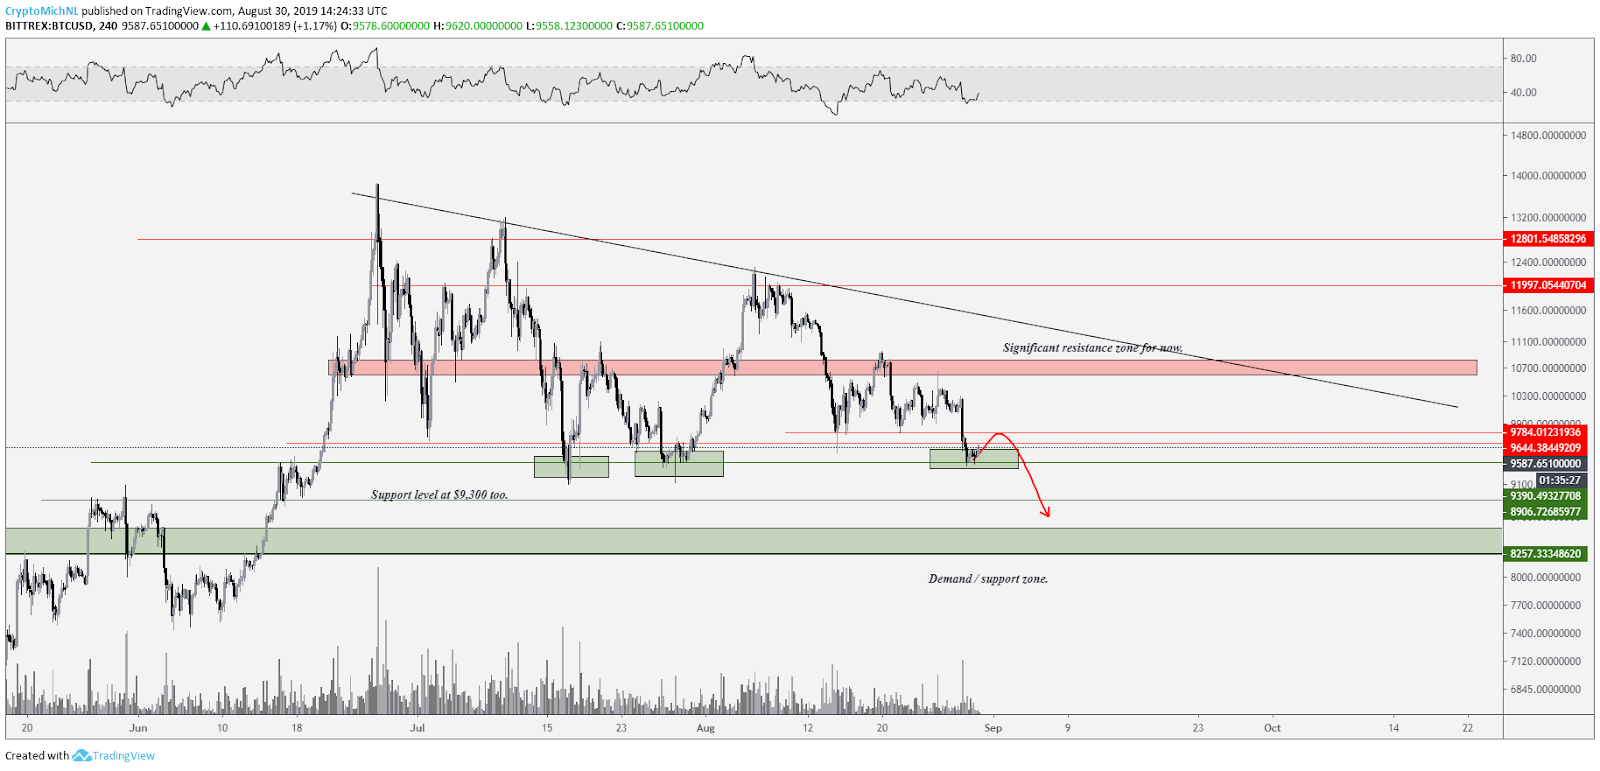
At this point, Bitcoin price has broken an important trendline. This caused the price to drop from $10,200 to the support level of $9,300, which is being tested for the third time as we speak.
Bullish scenario
BTC/USD bullish scenario. Source: Tradingview
In a bullish scenario, the price has to break the $9,800 level (old support before the dropdown) and reclaim that as support. If Bitcoin is able to do so, then we’re aiming at $10,800 again (trendline and horizontal resistance zone).
Bearish scenario
BTC/USD bearish scenario. Source: Tradingview
If Bitcoin won’t be able to break the $9,800 level again and turns it into resistance (or the $9,650 zone), the lower support levels at $8,900 and the possible area around $8,500 are likely to be tested, given the prior analysis of the 100-week MA ranging around $8,500 and the CME futures gap at $8,500.
In case of a bearish breakdown, it might be expected that the drop will be quite short. If we turn to Crypto Twitter, the majority tends to believe in a move towards $8,500.
This could also lead to a very brief drop, which can be bought up quickly, or to a move that never happens on that level (frontrunning). Of course, it’s quite common that when the majority expects a move to happen, the exact opposite occurs.
All in all, the movements of Bitcoin price are seemingly natural and healthy for an upwards trending market, and offer opportunities to buy the dip.
The views and opinions expressed here are solely those of the author and do not necessarily reflect the views of CryptoX. Every investment and trading move involves risk. You should conduct your own research when making a decision.


