
A new XRP price prediction from notable crypto analyst, EGRAG CRYPTO, has investors buzzing. Based on a multi-timeframe analysis, Egrag believes XRP is showing considerable strength, hinting at a potential surge to $1.4. The analyst elucidated his predictions in a tweet, stating, “XRP Color Code To $1.4 – UPDATE: Trying to showcase the sheer strength and achievements of XRP from multiple time frames: Weekly, 3D, 1D, and 4H.”
XRP Price Analysis: 1-Week Chart
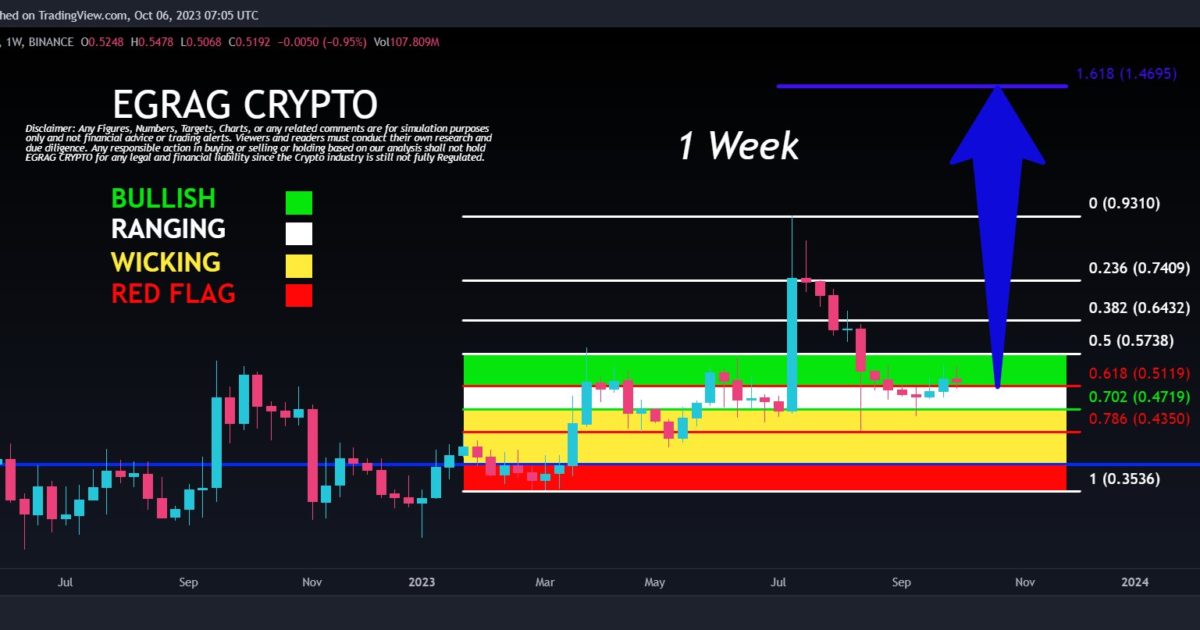
Delving into the Weekly Chart, Egrag finds an evident optimistic momentum. XRP is on the brink of achieving a notable milestone: sealing a full-body candle beyond the Fib 0.618 retracement level at $0.5119. Egrag notes that the imminent week’s closure and the definitive form of the candle would serve as a robust affirmation of this trend.
Egrag’s meticulous breakdown pinpoints vital landmarks for the XRP price trajectory in the 1-week chart. The wicking range is demarcated between $0.3875 and $0.4719. Any downward breach below $0.3875 might disrupt the broader chart setup.
Meanwhile, the ranging region, where XRP could oscillate without clear directional momentum (and which XRP is currently leaving), is situated between $0.4719 and $0.5119. Eclipsing the $0.5119 boundary in the weekly timeframe propels XRP into a bullish domain, leading up to $0.5738 — in sync with the 50% Fibonacci retracement echelon.
The crypto analyst postulates that the breach of this pivotal price level could catalyze a sweeping XRP rally. Venturing past the 50% Fibonacci zone might result in a landscape with scant resistance, potentially allowing XRP to shatter its annual peak at $0.9310. Concluding his extensive analysis, Egrag envisages an audacious endgame: a staggering 250% rally, propelling XRP towards the 1,618 Fibonacci extension at $1.4695.
Shorter Time Frames
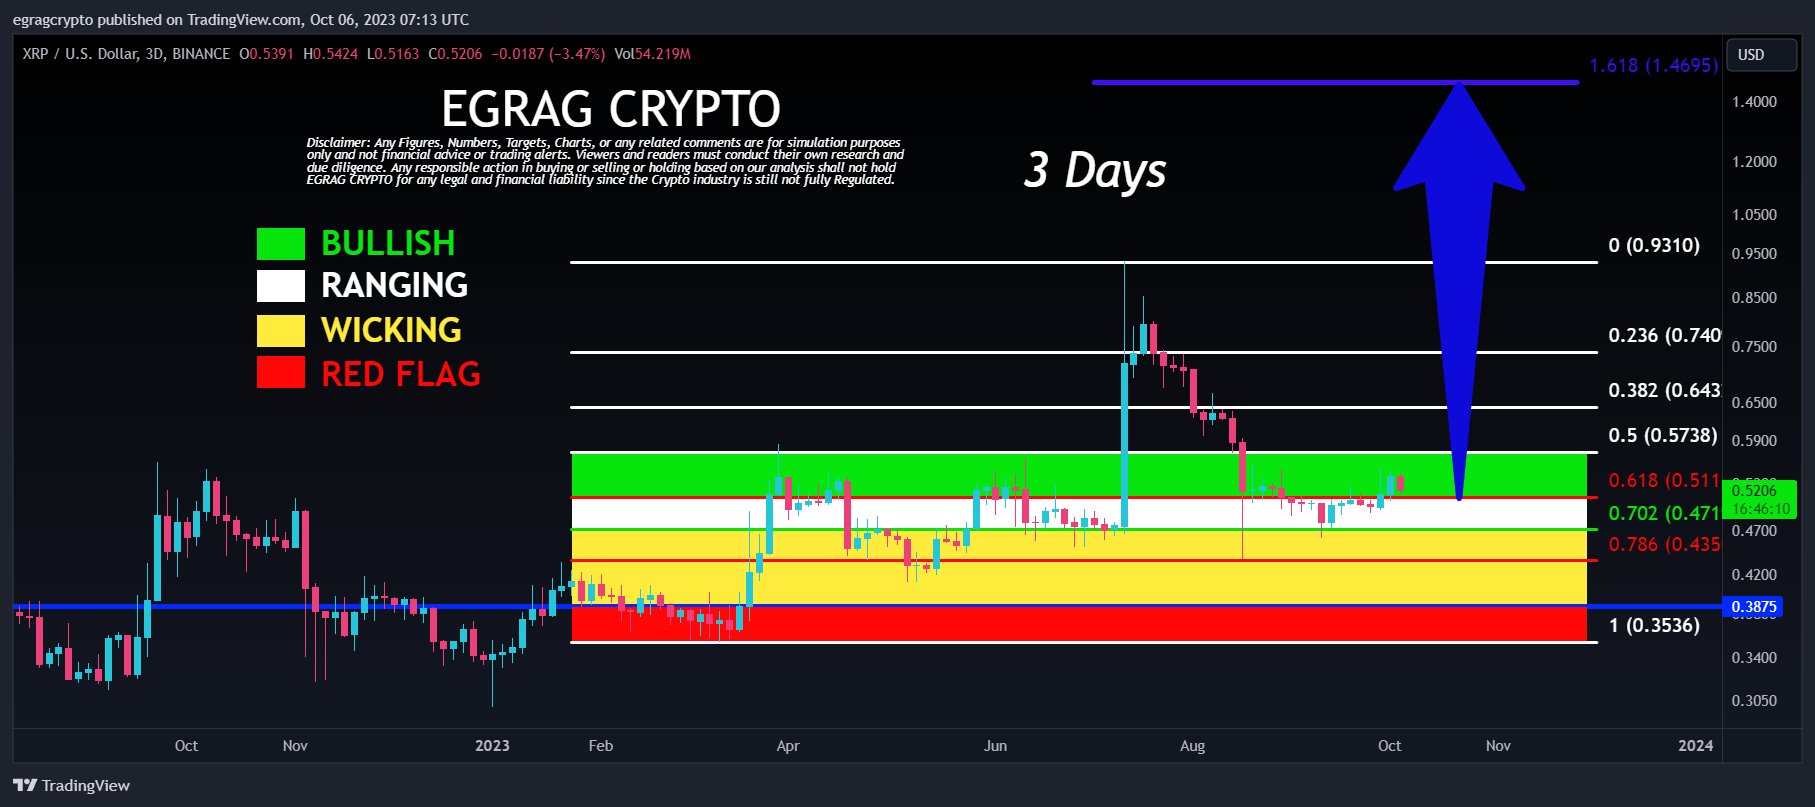
Switching focus to the 3-day chart, XRP displays a body candle close above the Fibonacci 0.618 retracement level, indicating its presence in the bullish zone. Yet, the current shape of the candle is a neutral Harami style, leaving room for interpretation and lacking a decisive forward direction.
This particular formation, rooted in the Japanese term for “pregnant,” represents a potential inflection point in the price movement. Yet, its neutrality necessitates waiting for more concrete signals. Egrag emphasizes that the impending candle, closing today, might shed light on pivotal insights.
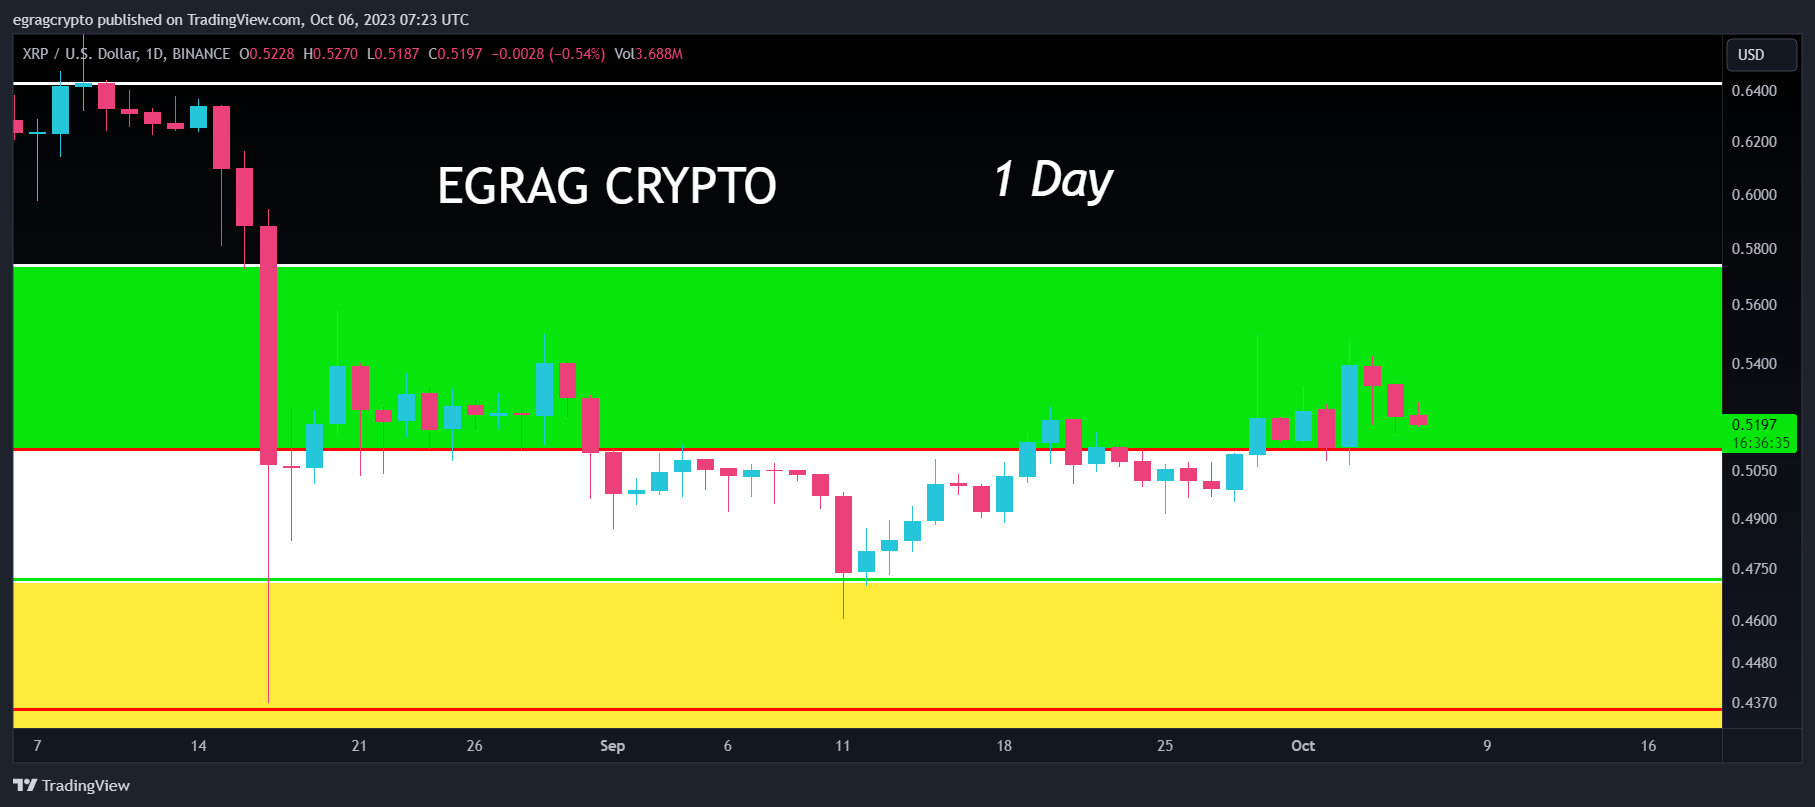
In the 1-day Chart, the narrative is more assertive. XRP has successfully wrapped up seven consecutive daily candles beyond the Fib 0.618 benchmark in the green area. This trend, as Egrag postulates, radiates a palpable bullish aura. But he also advises vigilance for a potential retest of the lower boundary of the bullish green area, which could solidify this foundation.
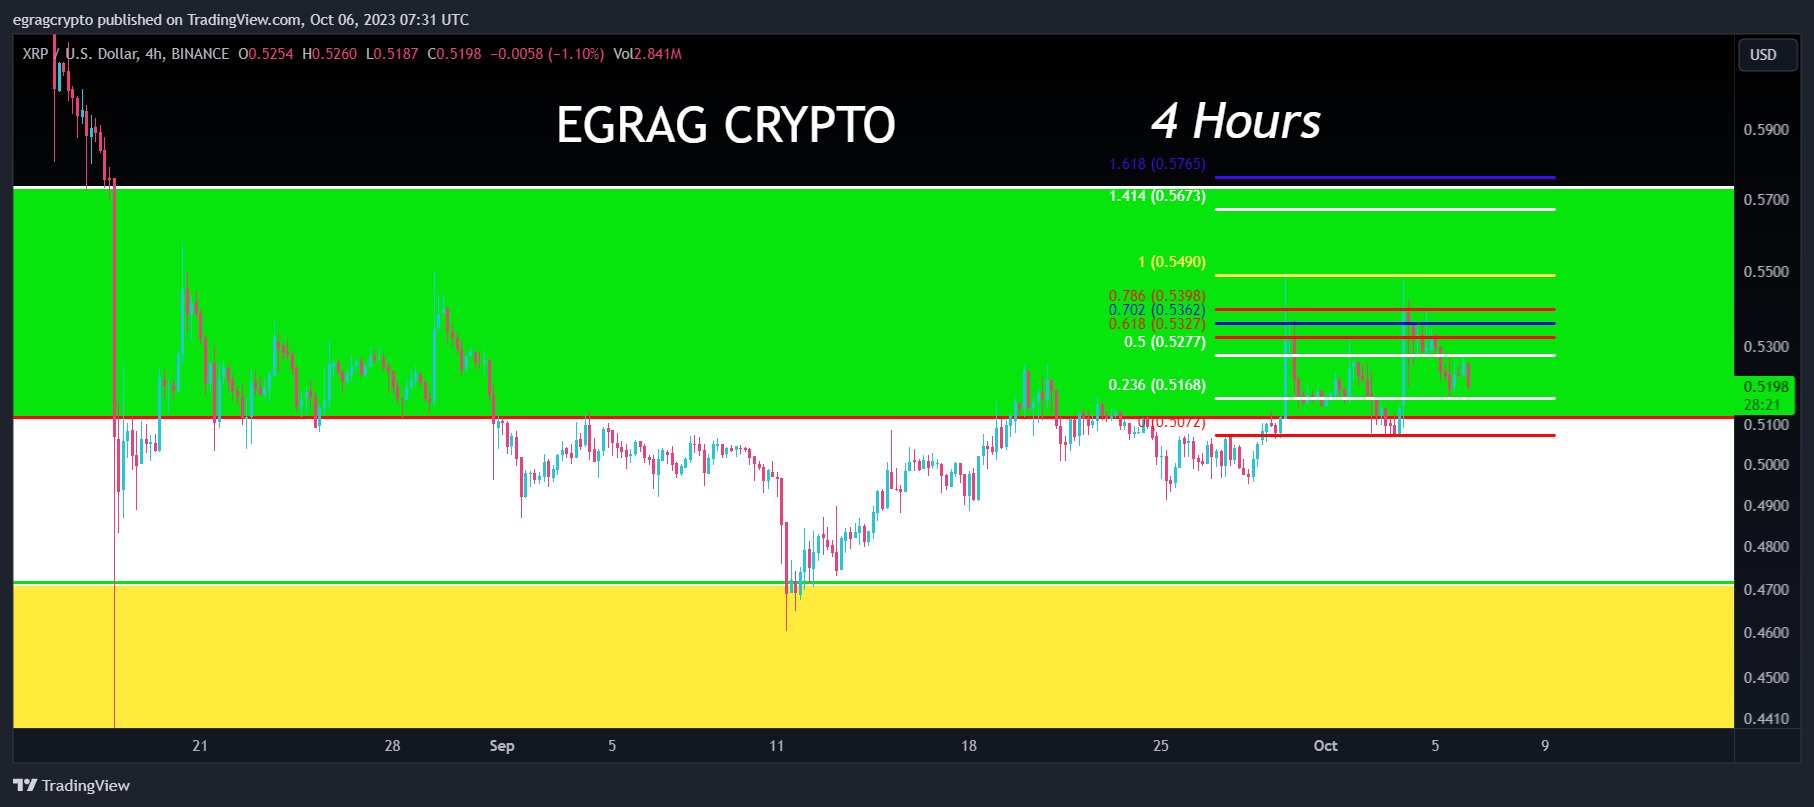
Lastly, when inspecting the 4-hour chart, a discernible double-top pattern emerges. With XRP exhibiting resistance to surpass the $0.55 mark, there is heightened anticipation of a possible double bottom near $0.50. This movement could pave the way for an assault on the Fib 1.618 zone, around $0.576. The crypto analyst forecasts this as a precursor to a bullish continuation.
At press time, XRP traded at $0.52073. The 1-hour chart shows $0.5264 as the current key resistance and $0.5197 as the key support.
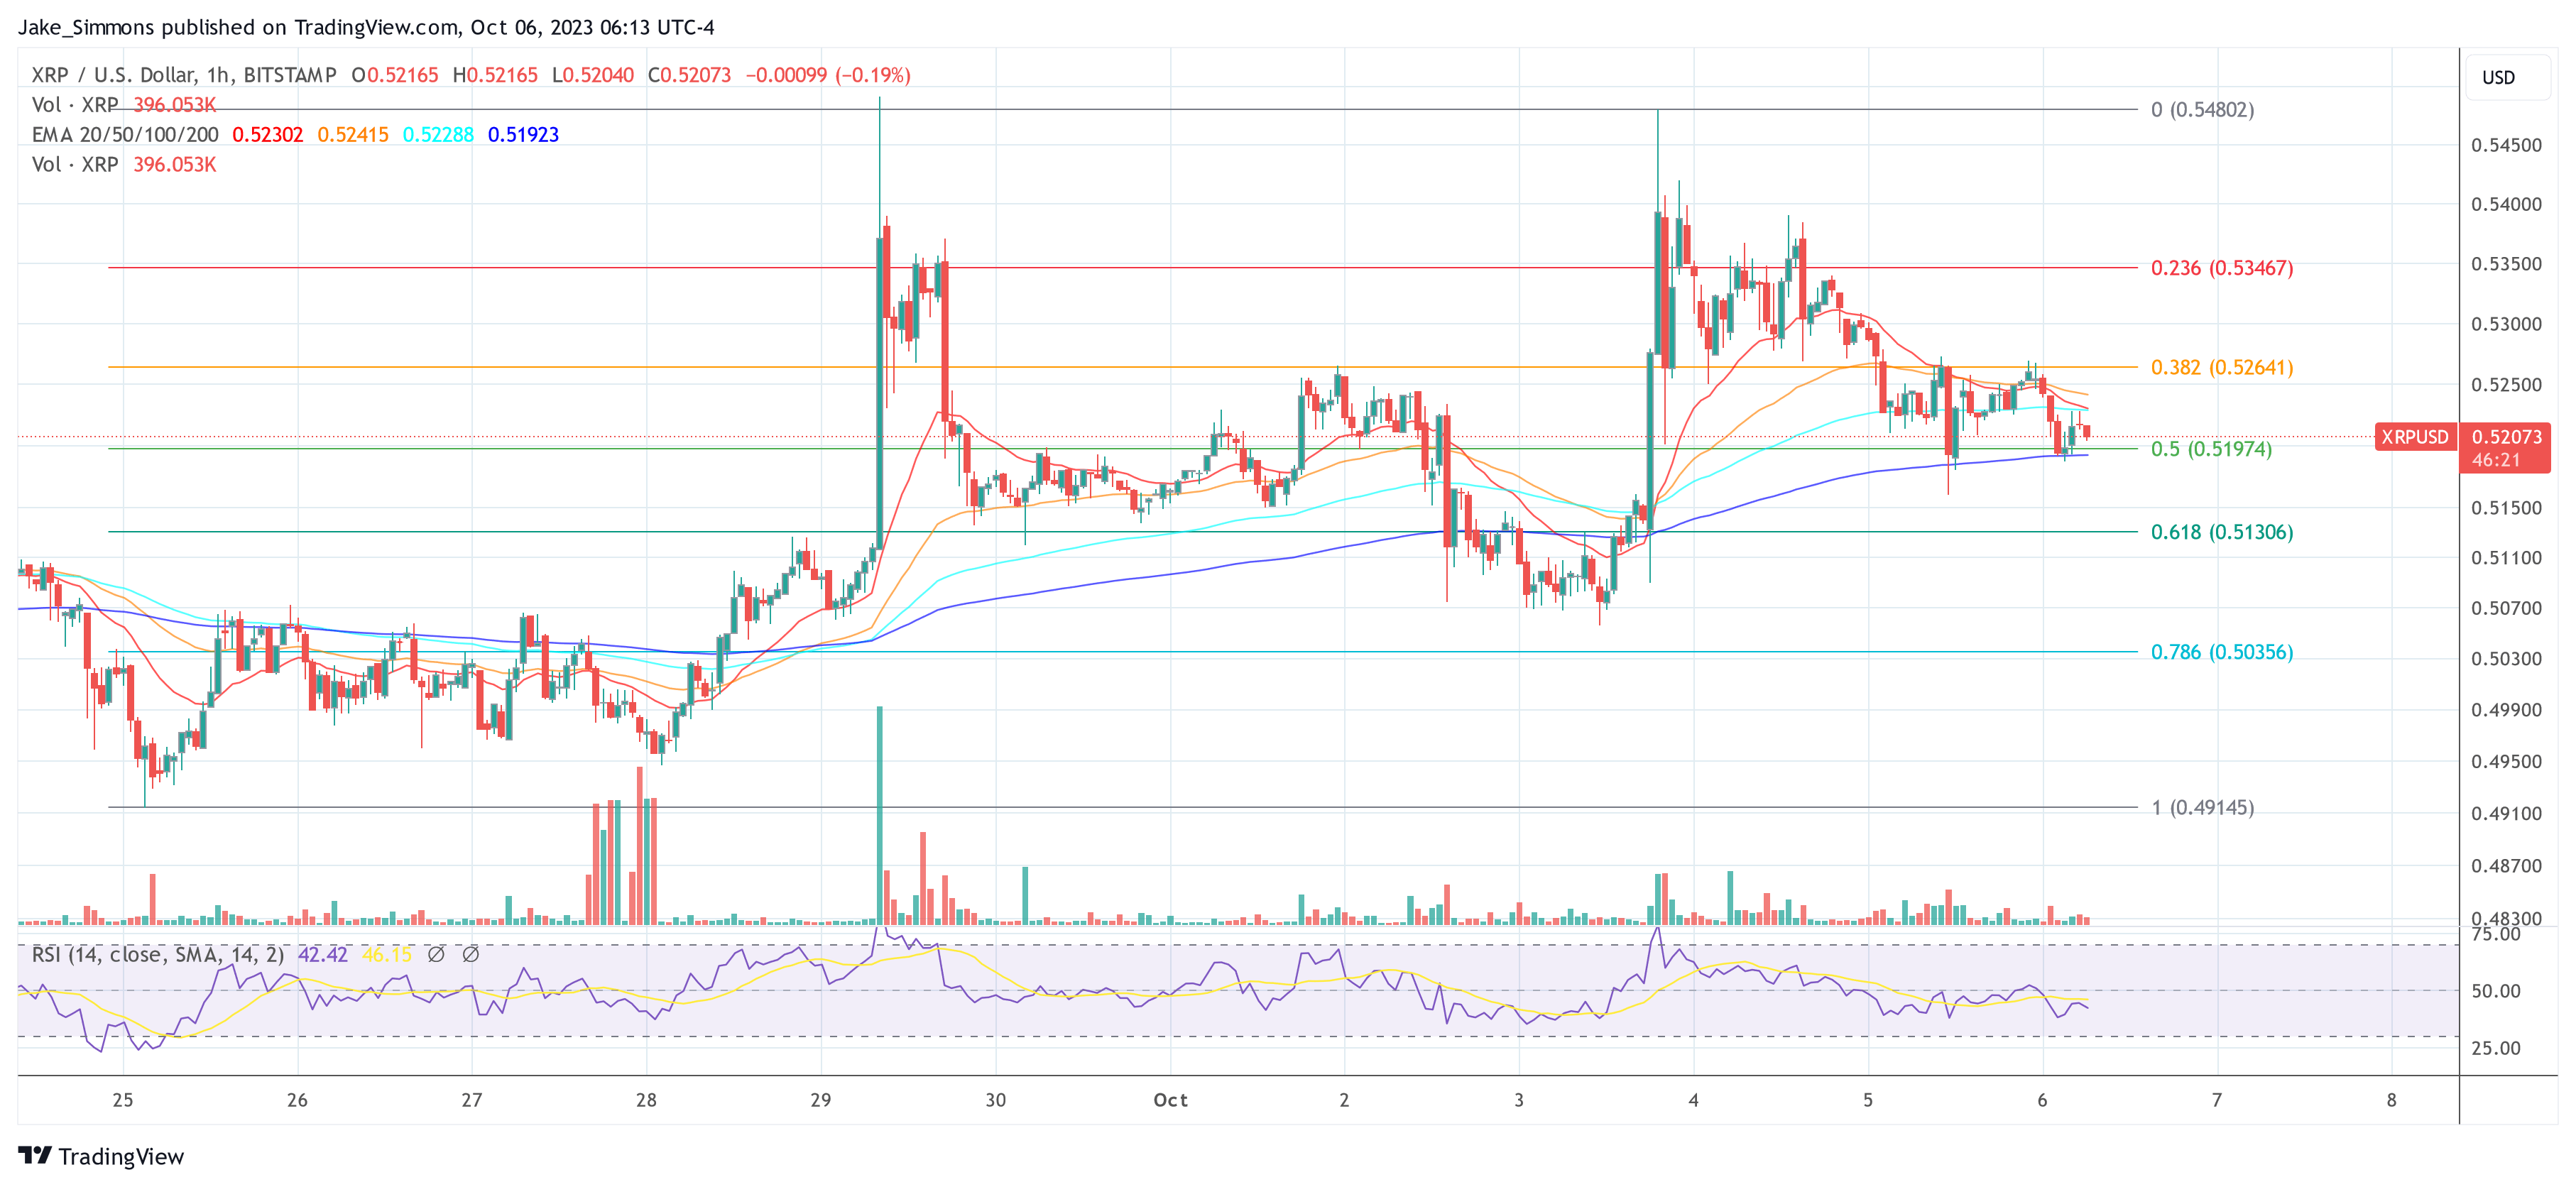
Featured image from Shutterstock, chart from TradingView.com


