
An analyst has revealed the level of XRP might observe a pullback following the latest rejection in the cryptocurrency’s price.
XRP Has Seen Rejection At Mid-line Of An Ascending Parallel Channel
As explained by analyst Ali in a new post on X, XRP has appeared to have been moving inside an Ascending Parallel Channel recently. An “Ascending Parallel Channel” refers to a pattern in technical analysis that’s used for identifying uptrends and potential reversal points for any asset’s price.
As the name already suggests, the pattern involves two parallel lines that make up the “channel” within which the price action is mostly contained. The upper line is made by connecting higher highs, while the lower one strings together higher lows.
At the upper line, the asset might be more likely to feel some resistance and get rejected back inside the channel, while the lower line could provide support to it.
In the scenario that the price makes a breach of these channel lines, a sustained break might take place. Naturally, a breakout above the upper line would be a bullish one, while that below the lower one could signal the continuation of the bearish trend.
Like the Ascending Parallel Channel, there is also the “Descending Parallel Channel,” which is obviously a pattern used whenever the market is showing a clear trend towards the downside.
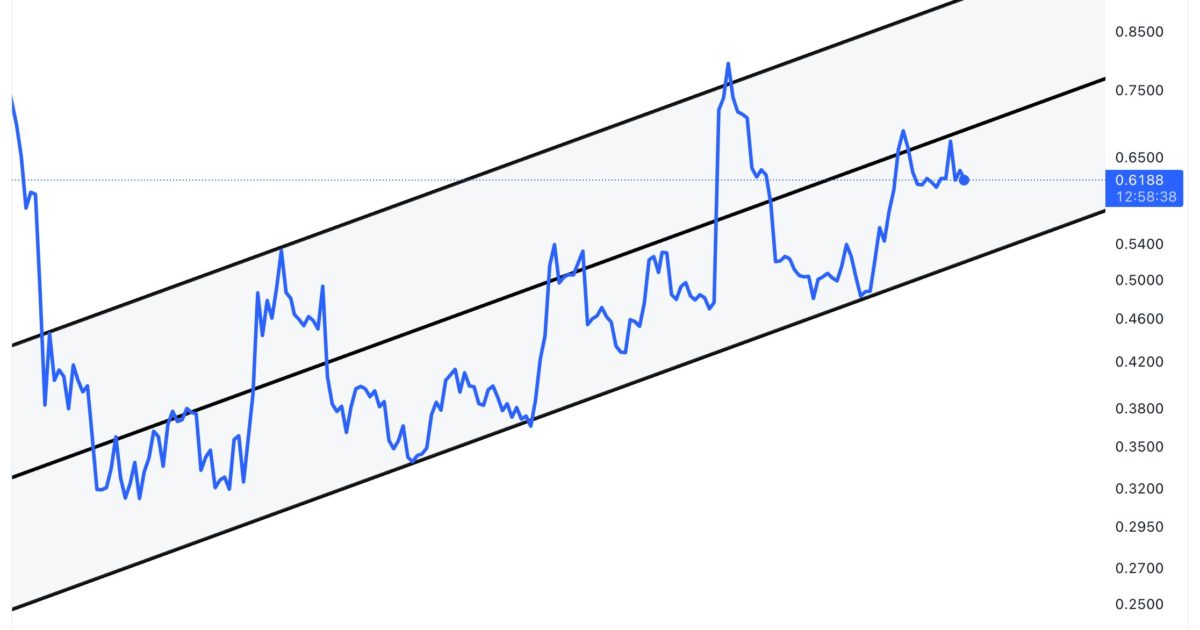
Now, here is the chart shared by Ali that shows an Ascending Parallel Channel that XRP has been stuck inside for quite some time now:
The parallel channel that the asset has been moving inside recently | Source: @ali_charts on X
As is visible in the graph, XRP’s price top back in July of this year coincided with a temporary break above the upper line of this Ascending Parallel Channel pattern. Since this rejection, the asset hasn’t yet been able to revisit the level.
In the chart, the analyst has also drawn a third line: the mid-point between the two parallel trend lines of the pattern. This line has also appeared to have acted as resistance for XRP during the duration it has traveled inside the channel, as it has often hit local tops on interactions with it.
Recently, after bottoming out at the lower level following the earlier rejection, the asset climbed towards this middle line and made a retest of it. The coin appears to have been rejected from it, however, as it has been sliding down since then.
“After facing rejection at the channel’s mid-line, XRP might see a pullback toward the lower boundary, around $0.55,” explains Ali. At the time the analyst had posted the chart, the asset had been trading around $0.618, but since then, it has observed a further 5% drawdown.
With the coin continuing to show decline, it would appear possible that it might go all the way to the $0.55 level Ali has pointed out, before finding a potential reversal. From the current price, such a drop would suggest a decrease of over 6%.
XRP Price
XRP has plunged towards $0.585 today as the cryptocurrency market as a whole has seen red returns.

Looks like the price of the asset has seen a sharp decline during the past day | Source: XRPUSD on TradingView
Featured image from Shutterstock.com, charts from TradingView.com
Disclaimer: The article is provided for educational purposes only. It does not represent the opinions of NewsBTC on whether to buy, sell or hold any investments and naturally investing carries risks. You are advised to conduct your own research before making any investment decisions. Use information provided on this website entirely at your own risk.


