

Synthetix (SNX) remained in a bullish zone above $15.00, despite pullbacks in bitcoin and ethereum against the US Dollar. SNX price is likely to rally towards $20.00 if it clears the $16.00 hurdle.
- There was a steady increase in synthetix’s SNX price above $12.00 against the US dollar.
- The traded to a new yearly high at $16.01 and settled well above the 100 simple moving average (4-hours).
- There is a major rising channel forming with resistance near $16.00 on the 4-hours chart of the SNX/USD pair (data source from Coinbase).
- The pair is likely to continue higher towards $18.00 and $20.00 as long as it is above $12.50.
SNX Could Rally Further
After a close above the $12.00 and $12.50 pivot levels, SNX saw a steady increase towards the $15.00 level against the US Dollar. Recently, there was a sharp downside correction in bitcoin, ethereum, and other major altcoins.
However, SNX remained in a bullish zone above $14.00 and $15.00. It even broke the $15.50 level and traded to a new yearly high at $16.01. It is currently consolidating gains above $15.00 and the 100 simple moving average (4-hours).
An initial support on the downside is near the $14.65 level. It is close to the 23.6% Fib retracement level of the recent increase from the $10.31 low to $16.01 high. The first major support is near the $14.00 level.
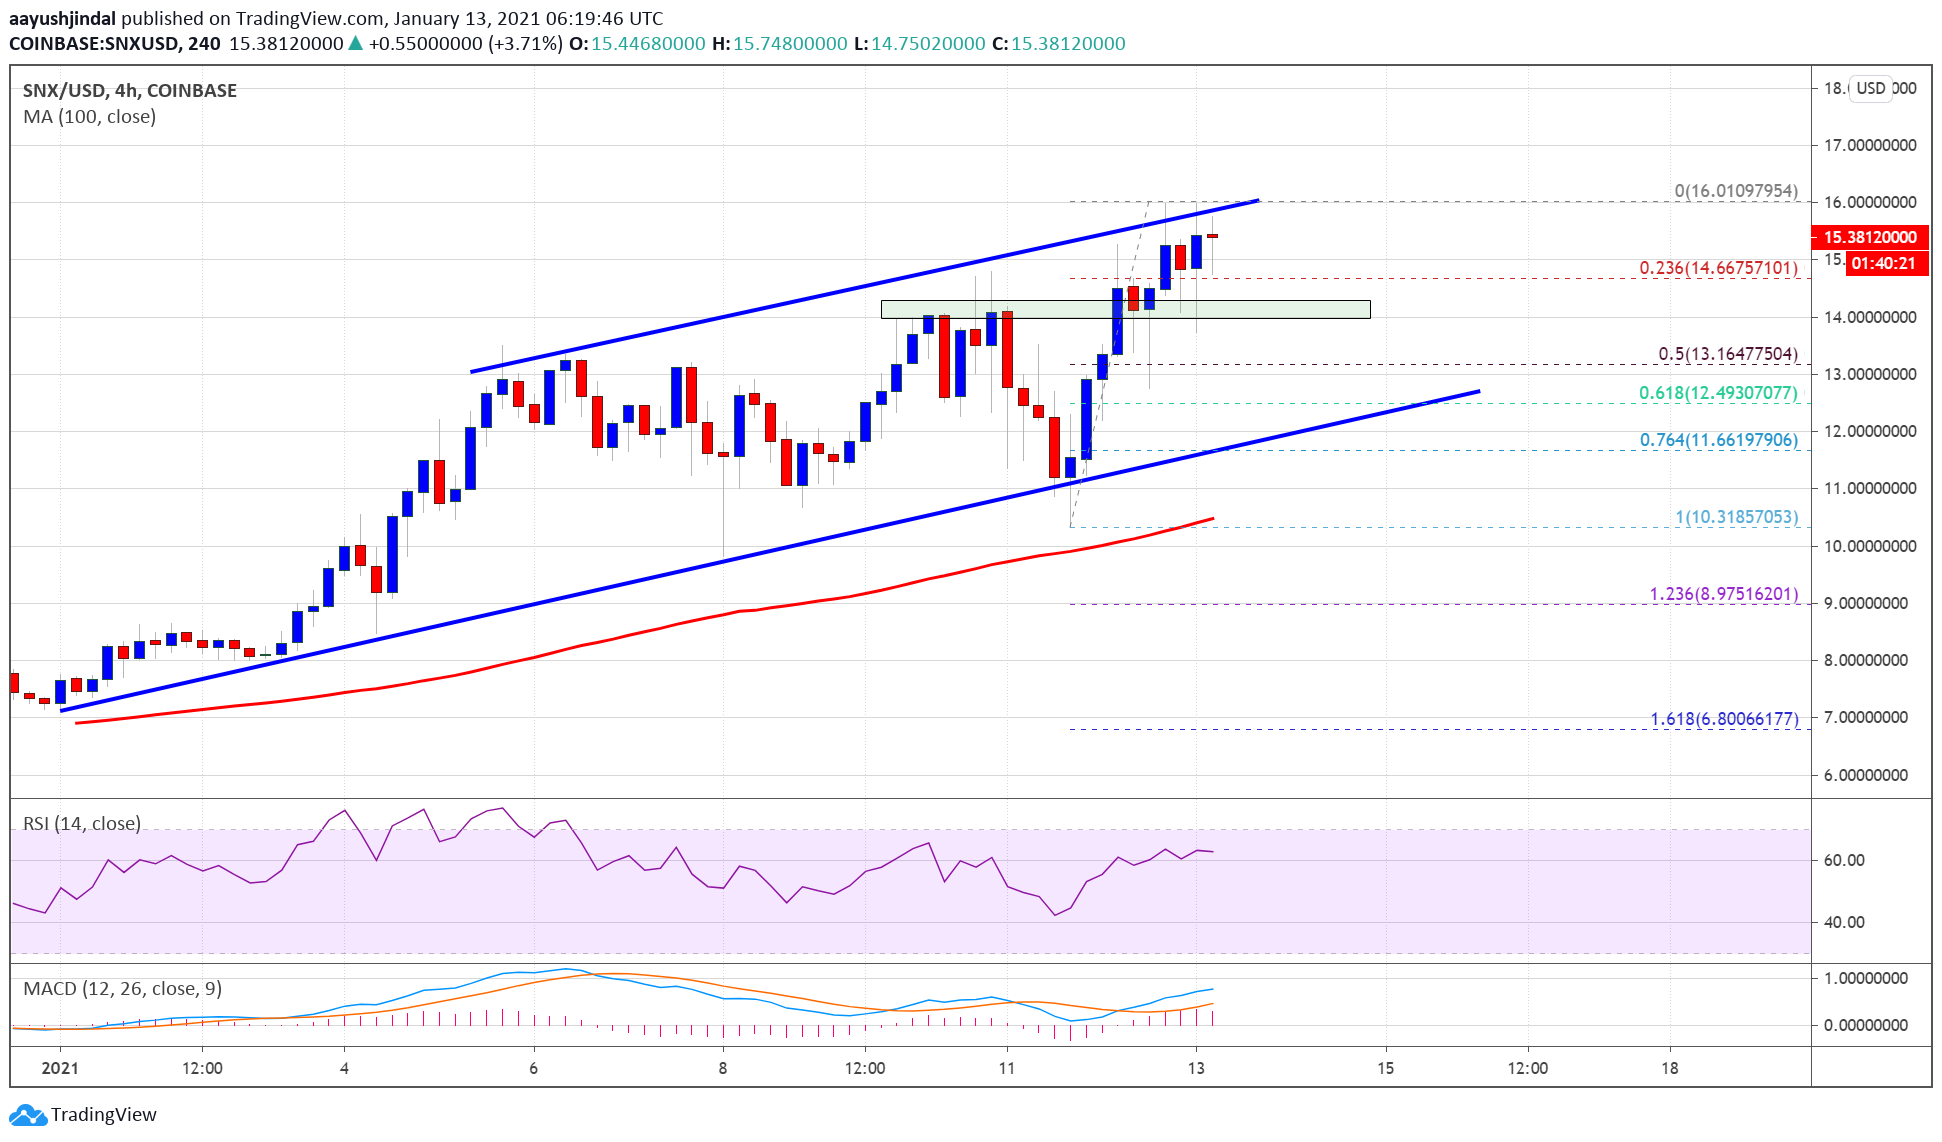
Source: SNXUSD on TradingView.com
On the upside, the bulls are facing hurdles near $16.00. There is also a major rising channel forming with resistance near $16.00 on the 4-hours chart of the SNX/USD pair. A clear break above the $16.00 level could open the doors for another rally.
In the stated case, the bulls are likely to aim a test of the $18.00 level. The next major resistance on the upside is near the $20.00 level.
Dips Supported?
If SNX price struggles to continue higher, it could correct lower below $14.50. The first major support is near the $14.00 level, below which it could test the 50% Fib retracement level of the recent increase from the $10.31 low to $16.01 high at $13.15.
The channel support is also near the $13.15 zone. A downside break below the channel support could start a major downside correction towards the $10.50 and $10.00 support levels.
Technical Indicators
4-hours MACD – The MACD for SNX/USD is gaining pace in the bullish zone.
4-hours RSI (Relative Strength Index) – The RSI for SNX/USD is currently well above the 50 level.
Major Support Levels – $14.65, $14.00 and $13.15.
Major Resistance Levels – $16.00, $18.00 and $20.00.


