

Solana is correcting gains from the $25 resistance against the US Dollar. SOL price remains supported and might aim for a fresh rally toward $30.
- SOL price started a downside correction after it failed to clear the $25 resistance against the US Dollar.
- The price is now trading above $23.00 and the 100 simple moving average (4 hours).
- There is a key contracting triangle forming with resistance near $23.90 on the 4-hour chart of the SOL/USD pair (data source from Kraken).
- The pair could start a strong rally if it clears the $24 and $25 resistance levels.
Solana Price Remains In Uptrend
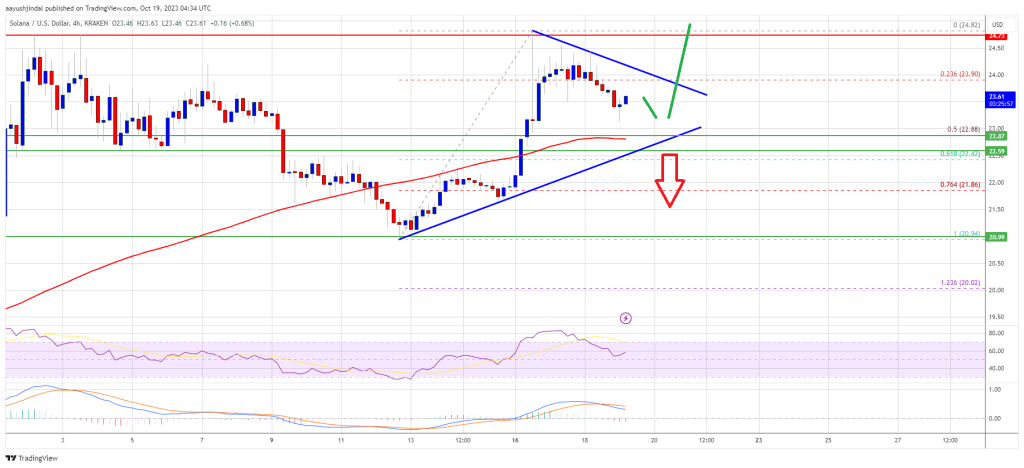
After a steady increase, Solana struggled to clear the $25 resistance zone. SOL formed a high at $24.82 and recently started a downside correction, like Bitcoin.
There was a move below the $24.20 and $22.00 levels. The bears pushed the price below the 23.6% Fib retracement level of the upward move from the $20.94 swing low to the $24.82 high. There is also a key contracting triangle forming with resistance near $23.90 on the 4-hour chart of the SOL/USD pair.
SOL is now trading above $23.00 and the 100 simple moving average (4 hours). It is now showing positive signs and remains supported above the $22.00 pivot level.
Source: SOLUSD on TradingView.com
On the upside, immediate resistance is near the $24.00 level and the triangle region. The first major resistance is near the $24.00 level. The main resistance is still near the $25.00 zone. A successful close above the $25.00 resistance could set the pace for a larger increase. The next key resistance is near $28.50. Any more gains might send the price toward the $30.00 level.
Are Dips Limited in SOL?
If SOL fails to recover above the $24.00 resistance, it could continue to move down. Initial support on the downside is near the $22.85 level or the 50% Fib retracement level of the upward move from the $20.94 swing low to the $24.82 high.
The first major support is near the $22.40 level. If there is a close below the $22.40 support, the price could decline toward the $21.80 support. In the stated case, there is a risk of more downsides toward the $20.50 support in the near term.
Technical Indicators
4-Hours MACD – The MACD for SOL/USD is losing pace in the bearish zone.
4-Hours RSI (Relative Strength Index) – The RSI for SOL/USD is above the 50 level.
Major Support Levels – $22.85, and $22.40.
Major Resistance Levels – $23.90, $24.00, and $25.00.
 Reaches Critical BTC Support as Sellers Grow Aggressive")

