
The price of BNB was up over 3% on June 14, in part due to bearish traders opening more BNB-tied contracts despite suffering losses via liquidations in the previous 24 hours. In addition, BNB (BNB) stands extremely “oversold,” which may have prompted traders to buy the dip.
BNB price bounces after being “oversold”
On June 14, the BNB price climbed nearly 4% to $253. The gains came as part of a recovery that saw the price rebounding 12% two days after falling to a six-month low of $220.
From a technical perspective, BNB’s rise on June 14 came on the heels of its “oversold” status. Notably, the daily relative strength index (RSI) dropped to around 16.6 two days earlier, its lowest reading since March 2020.
An RSI reading below 30 typically precedes a consolidation or recovery period in the market.
For instance, the BNB daily RSI stint below 30 in December 2022 preceded a 50% price rally in the next two months.
BNB funding rate flips negative
The funding rate of BNB slipped below zero on June 10 and has been negative since. In other words, bearish traders are willing to pay bullish traders to keep their short bets open.
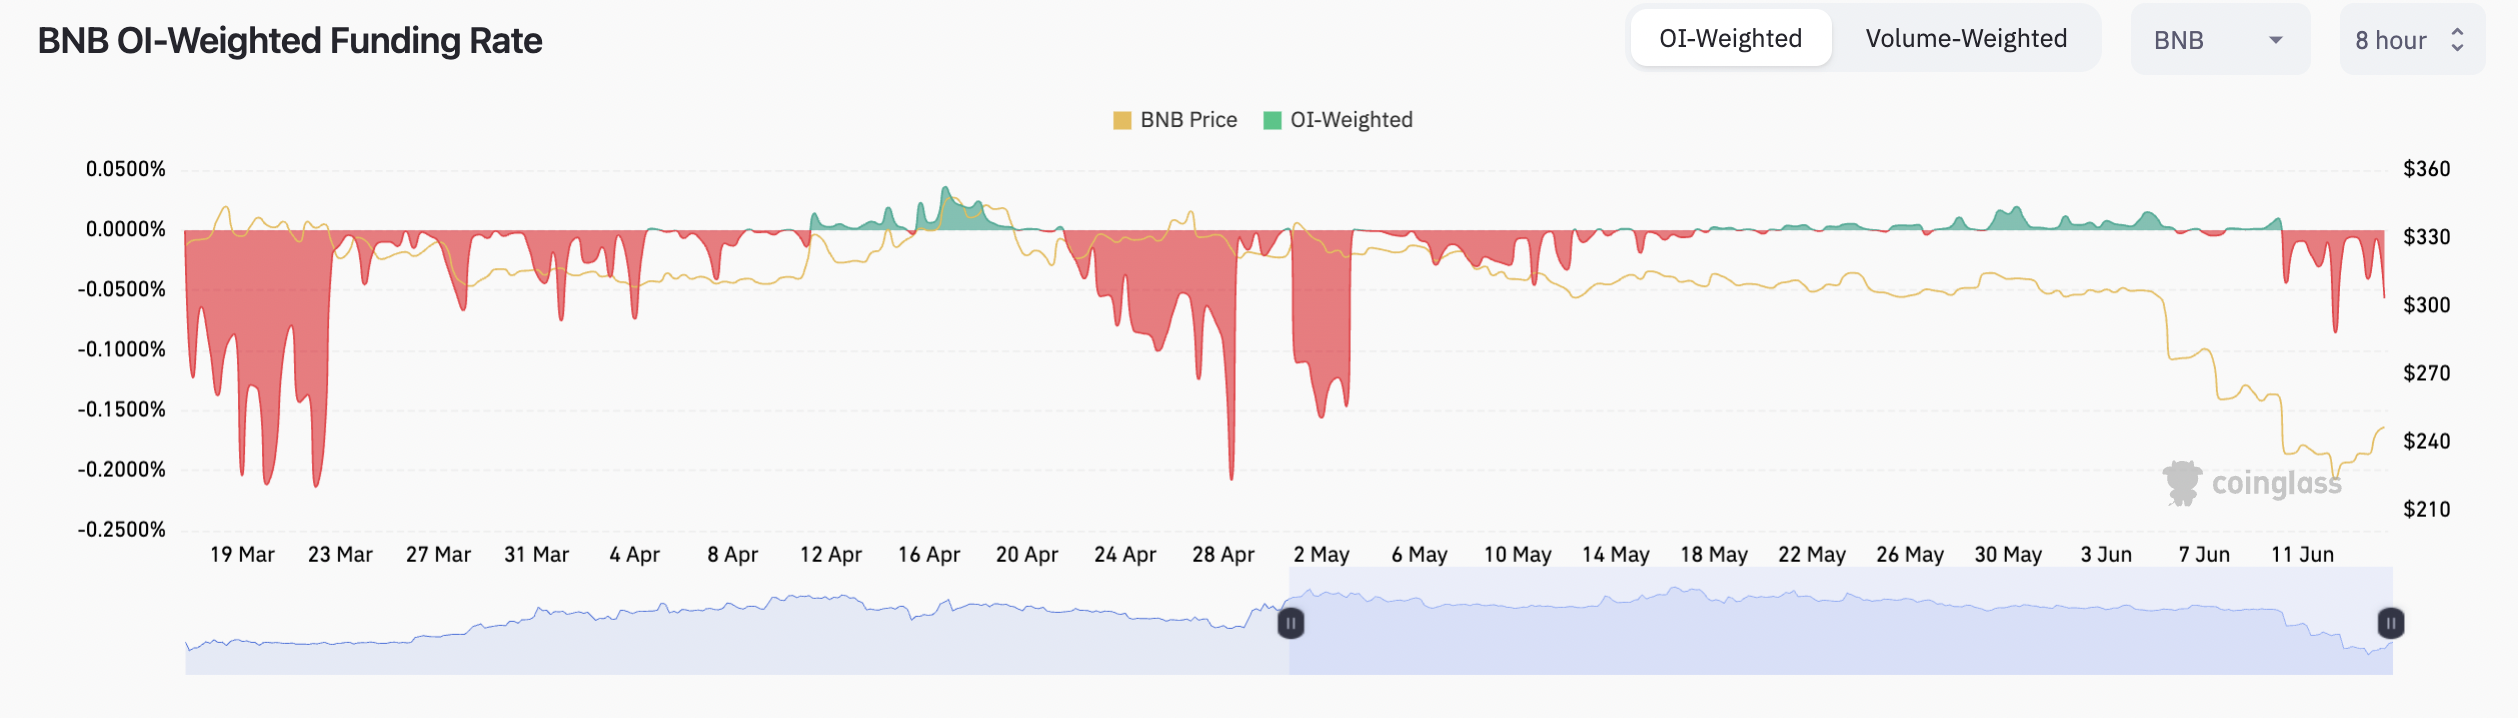
Meanwhile, BNB open interest has reached a one-month high of around $377 million, coinciding with an overall downtrend. All these metrics suggest that most traders are betting on more downside, which often results in price rebounds that can extend if short positions get liquidated.
Key BNB price level to watch
BNB’s price rebound also comes after a steep 25% decline last week, prompted by the United States Securities and Exchange Commission’s (SEC) lawsuit against Binance, which named BNB as an “unregistered security.”
Related: SEC and Binance.US to negotiate deal avoiding total asset freeze
In recent years, BNB’s price came under pressure due to broader crypto market declines, as shown below.
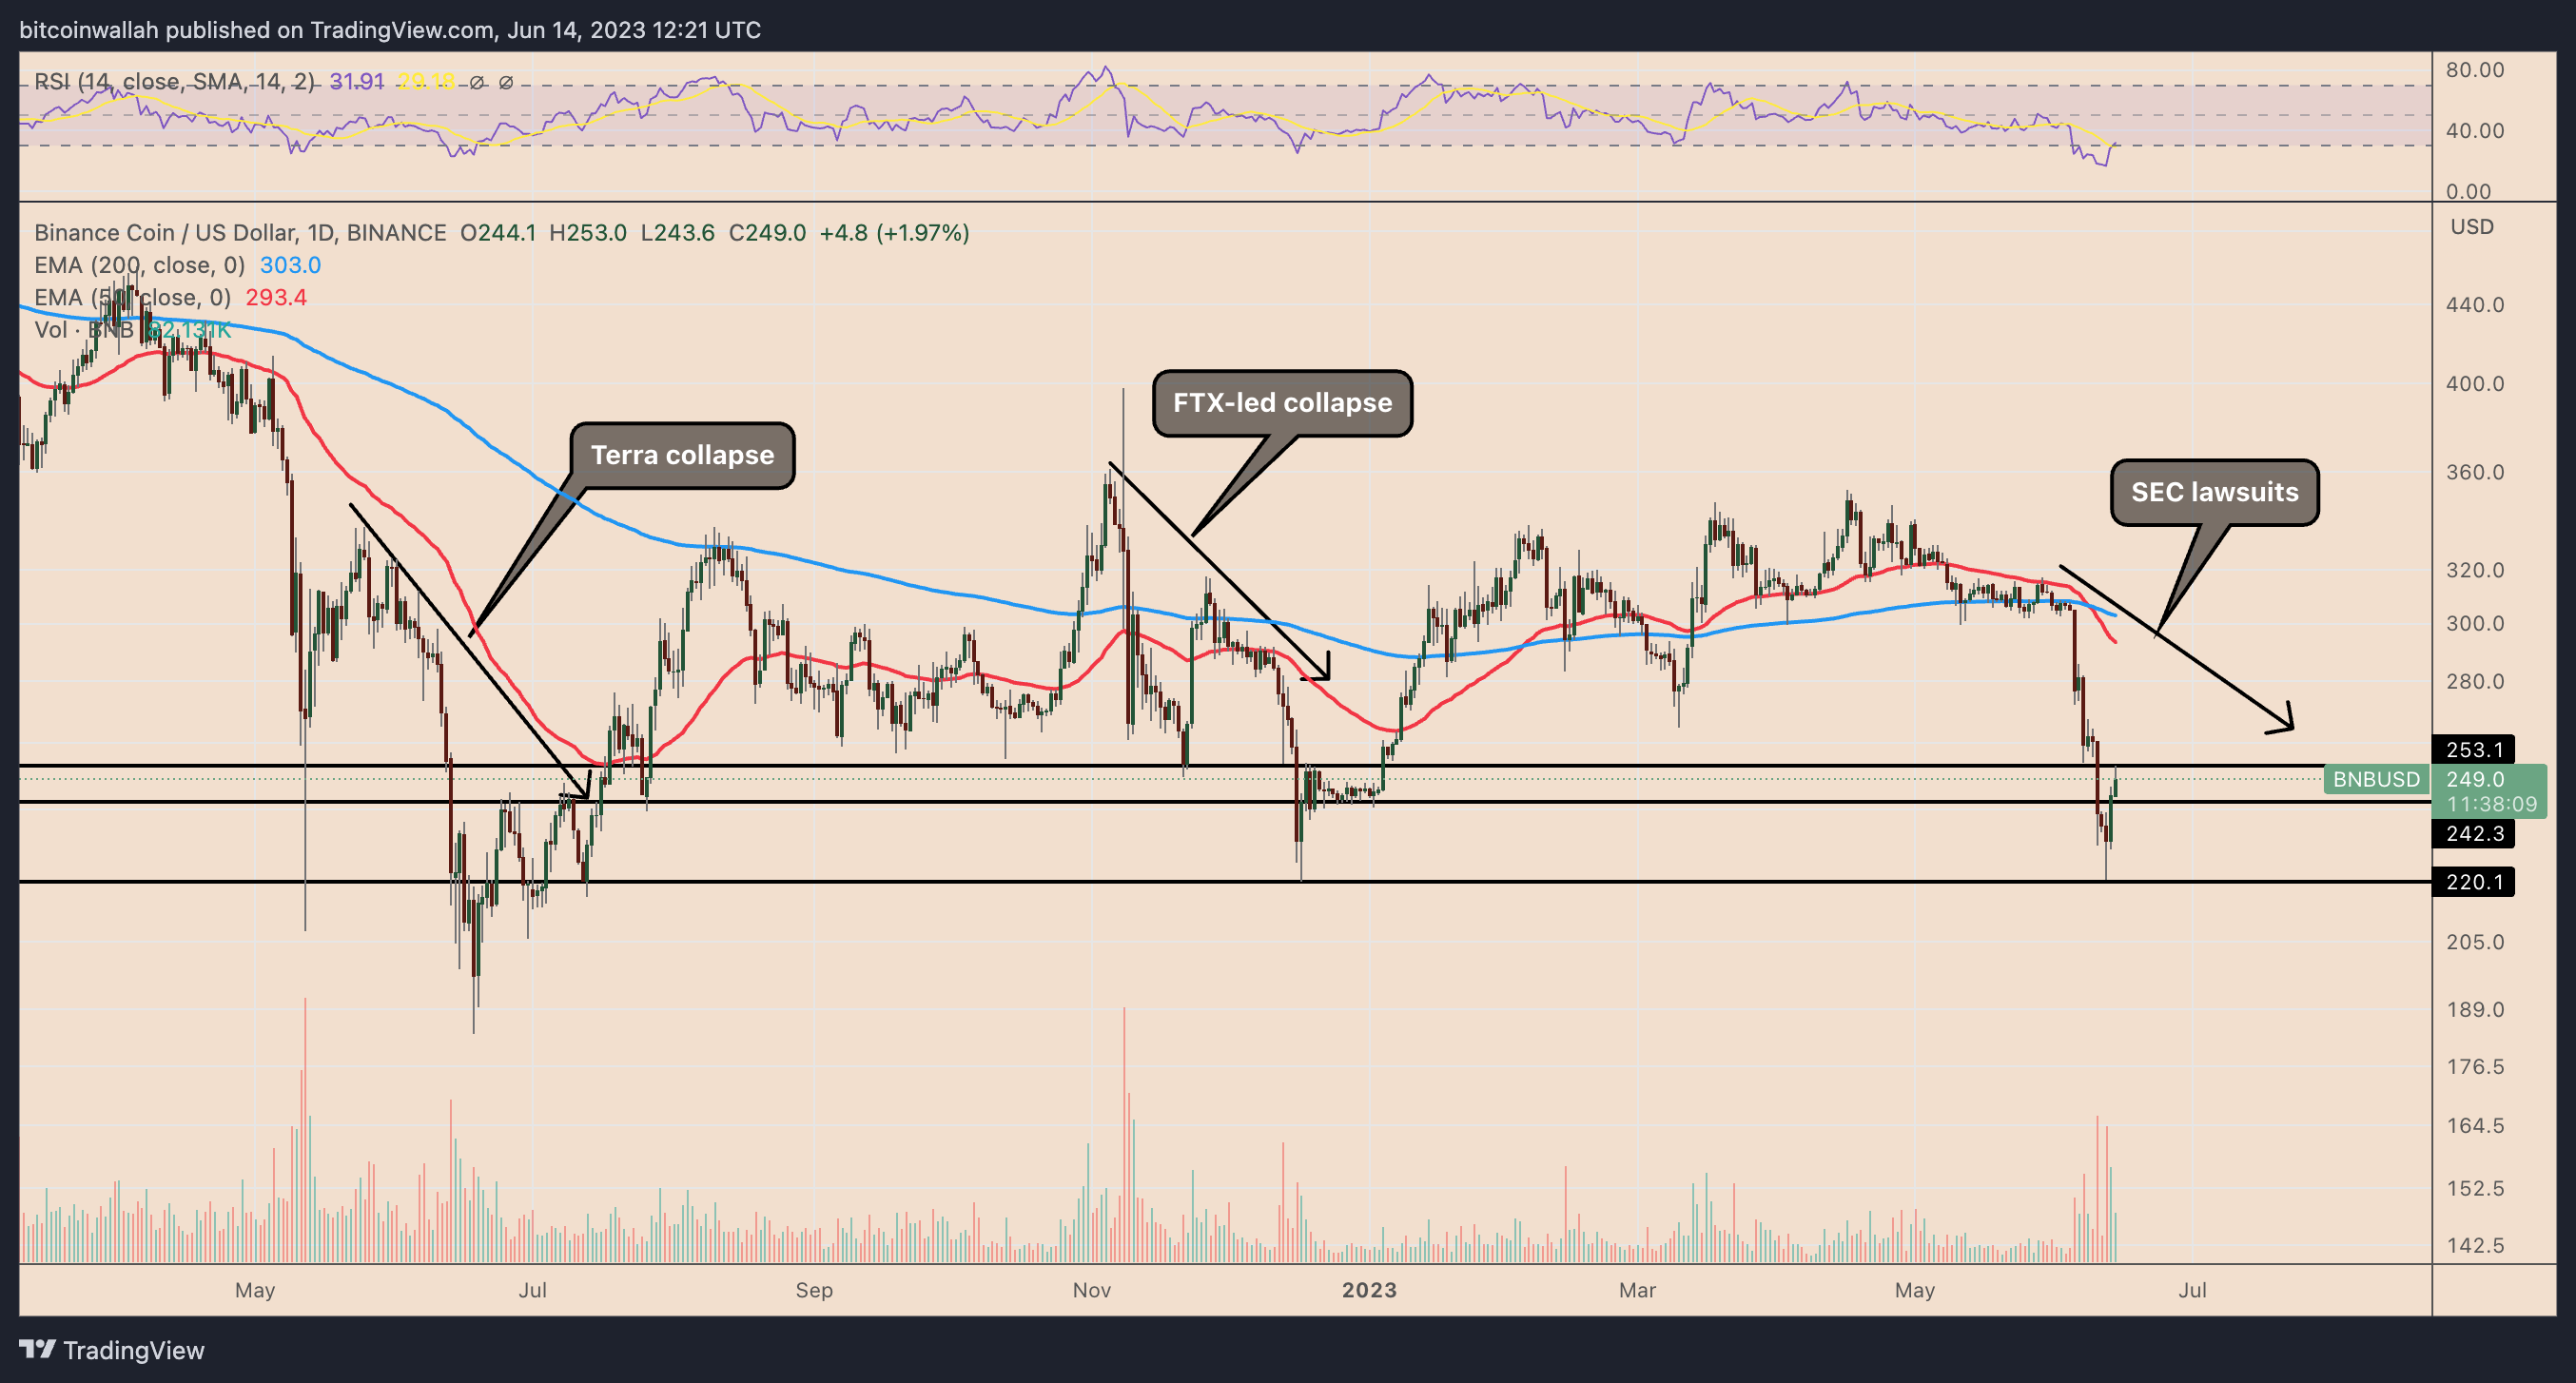
Each time, the BNB price discovered strong support near $220, which the bulls will argue should make this level an ideal buy zone after the SEC-led price drop — if history repeats.
As of June 14, BNB/USD trades inside the $240 to $250 range, a consolidation area from December 2022 to January 2023.
If the price decisively closes above the $250 resistance, then the primary upside target will be its 50-day exponential moving average (the red wave) near $300 in the third quarter, up around 20% from current prices.
Conversely, a close below $240 would risk crashing the price toward $220. If the sell-off continues, the next downside target to watch is likely in the $180 to $205 area.
This article does not contain investment advice or recommendations. Every investment and trading move involves risk, and readers should conduct their own research when making a decision.


