
The Bitcoin price currently remains in a vulnerable position. Meanwhile, recent on-chain data suggests that Bitcoin whales are accumulating, but contrary to popular rumors, BlackRock isn’t among them. Meanwhile, analysts are divided on whether the worst is behind for Bitcoin’s price.
Whales Accumulate Bitcoin, But It’s Not BlackRock
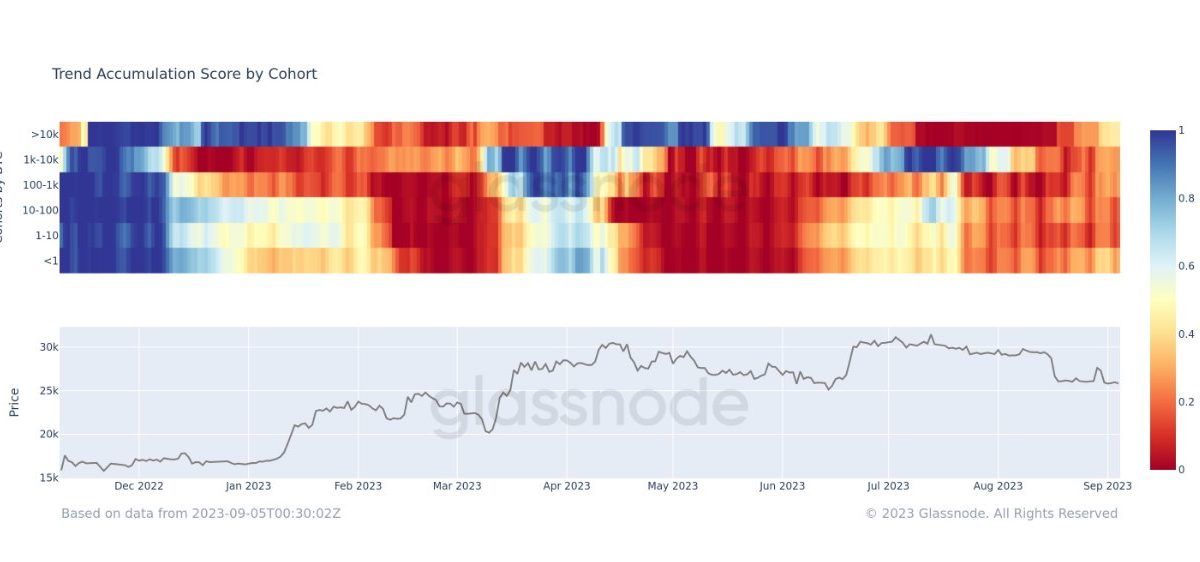
On-chain analyst James V. Straten recently highlighted a trend in the accumulation score by cohort chart. He remarked, “Seems like peak Bitcoin distribution is behind us, as we can see a slight tick-up in accumulation. This is the most aggressive accumulation since June/July for whales that have over 10k BTC.”
However, the waters are muddied by rumors surrounding BlackRock’s involvement. Speculation has been rife that BlackRock has been suppressing Bitcoin prices to buy cheap. But these claims are unfounded. “Many individuals don’t realize that BlackRock would require actual Bitcoin to back their Spot ETF. They might have already purchased their Bitcoin months ago when prices were lower,” is a statement that’s been debunked.
The reality is that BlackRock, being a financial behemoth managing people’s money, undergoes audits every three months. This means they can’t hide Bitcoin purchases from auditors. If they were to invest in Bitcoin, it would be through an exchange-traded fund.
In fact, BlackRock has already shown interest in the space by investing in Bitcoin mining stocks and MicroStrategy as a proxy. Remarkably, BlackRock is a major shareholder in 4 out of the 5 largest Bitcoin mining companies.
Is The Worst Behind For BTC Price?
The Bitcoin price trajectory remains a topic of intense debate among analysts. Will Clemente, a prominent figure in the space, shared the chart below and commented, “From a high-time-frame valuation perspective, Bitcoin’s position is intricate. While it’s not overheated relative to historical values, there’s a tangible risk of retesting the lows akin to Q1 2020.”

He further emphasized the prevailing market apathy, pointing to the lowest aggregated trading volume since 2020, the dwindling Google search trends for Bitcoin at multi year lows and realized volatility, implied volatility, weekly Bollinger Bands all near record lows.
Joe Burnett of Blockware Solutions chimed in with a compelling observation, “A staggering 94.6% of all Bitcoin remained stationary in the last 30 days. We set a record high at August’s end, and this might soon be surpassed. Historically, bear markets conclude when supply dries up. A mere spark of demand could ignite the next explosive bull market.”
Crypto traders, too, are closely monitoring key levels. @DaanCrypto remarked the significance of the $26K-26.1K range as it marks the daily, weekly and monthly open, high volume node and weekly VWAP. Therefore, for bulls, it’s the line of action, and for bears, it’s the fortress to defend.
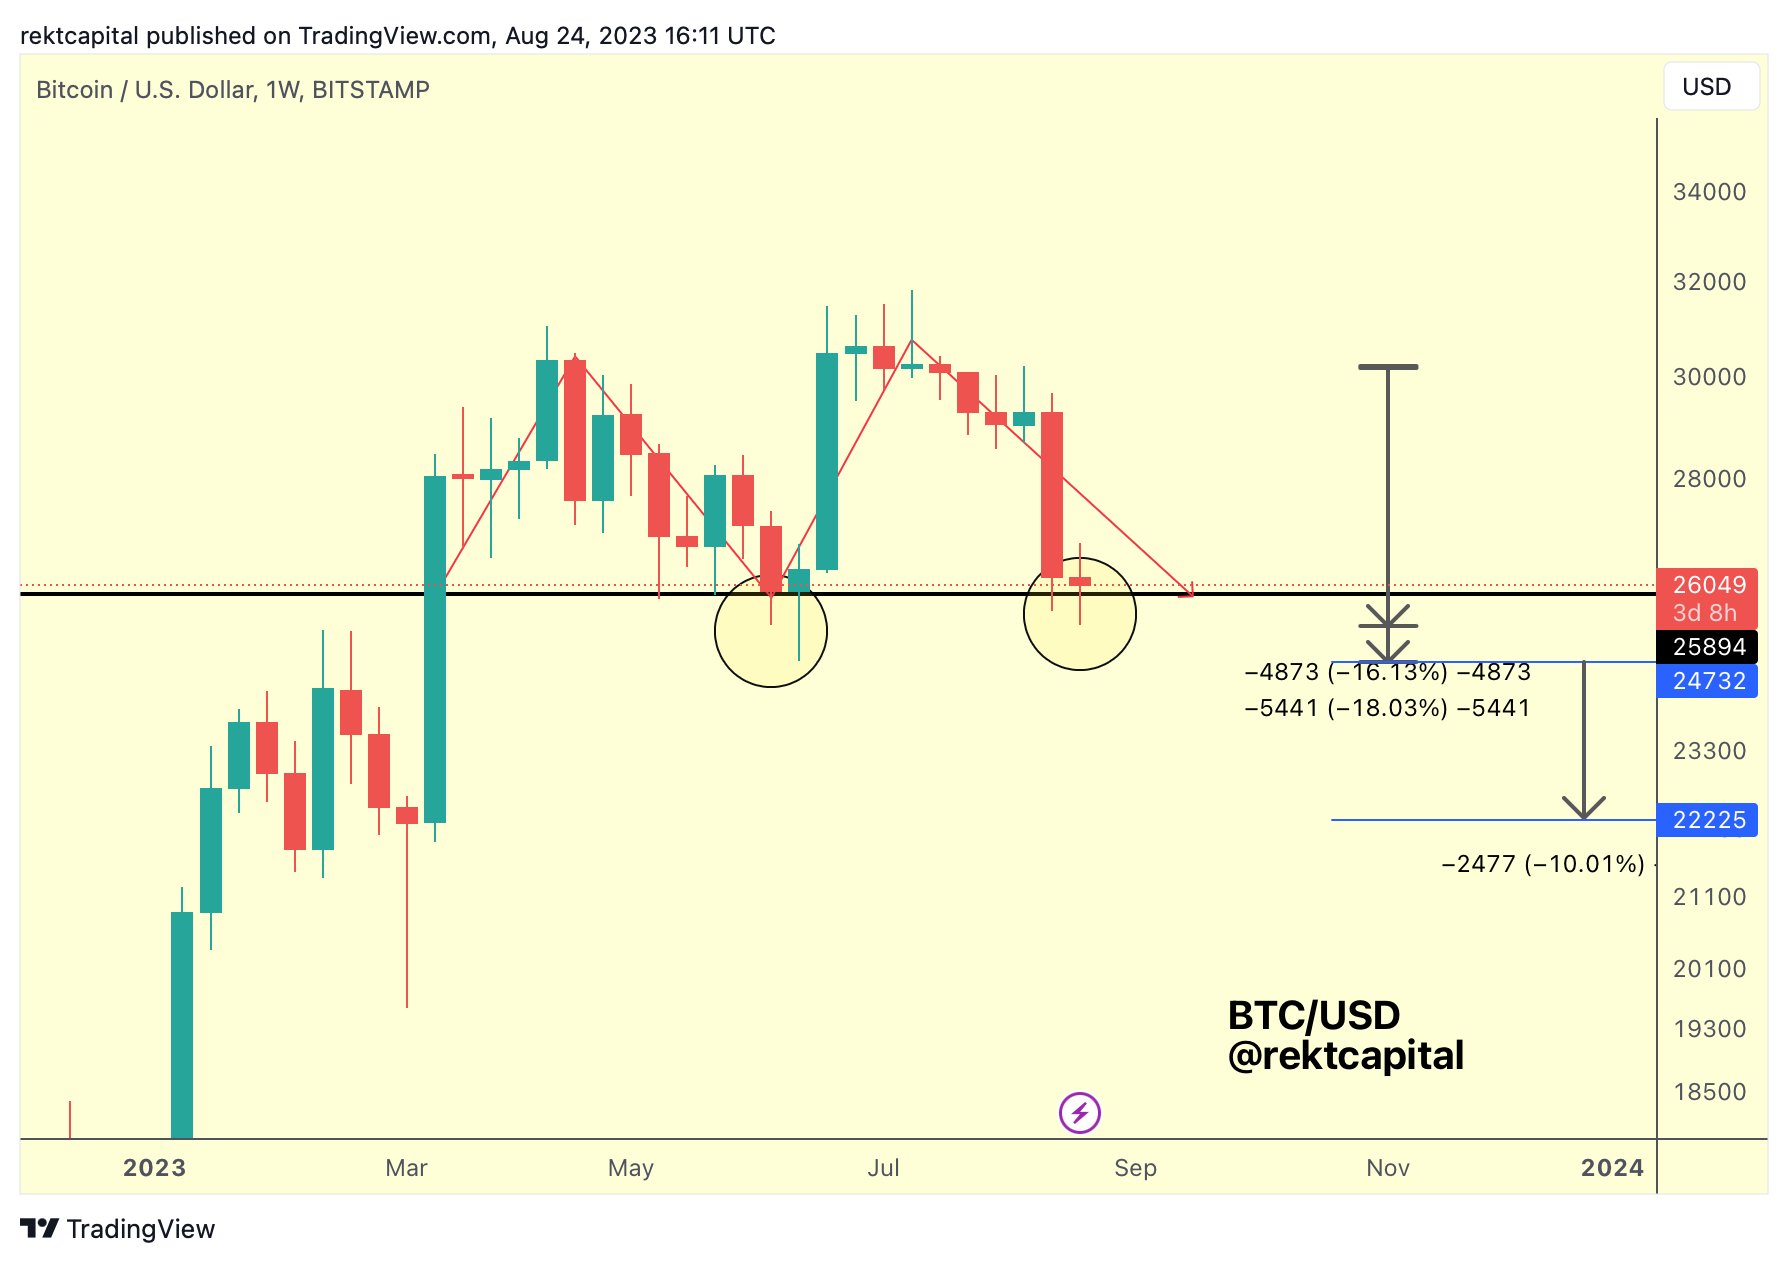
Rekt Capital, a well-regarded crypto analyst, has been closely monitoring Bitcoin’s price action, especially in relation to its volume dynamics. He also highlights the significance of the $26,000 support level on the weekly chart, pointing out that Bitcoin’s price has been hovering around this mark even after retracing most of its gains from the previous Grayscale rally.
However, the simultaneous decline in both buy-side and sell-side volumes is a cause for concern, suggesting a market that’s currently directionless. “The declining sell-side volume coupled with a lackluster buyer volume is concerning. Without a volume breakout, neither from sellers nor buyers, the market lacks momentum,” the analyst states.
On the topic of the double top, a traditionally bearish pattern, Rekt Capital indicated that a breach below the $26,000 mark on the weekly chart could potentially send BTC tumbling towards $22,000. However, he also hinted at a silver lining: an inverse head and shoulders pattern observed earlier this year. If Bitcoin approaches the $24,000 mark, which serves as the neckline for this pattern, it could act as a robust support and possibly signal a bullish turnaround.
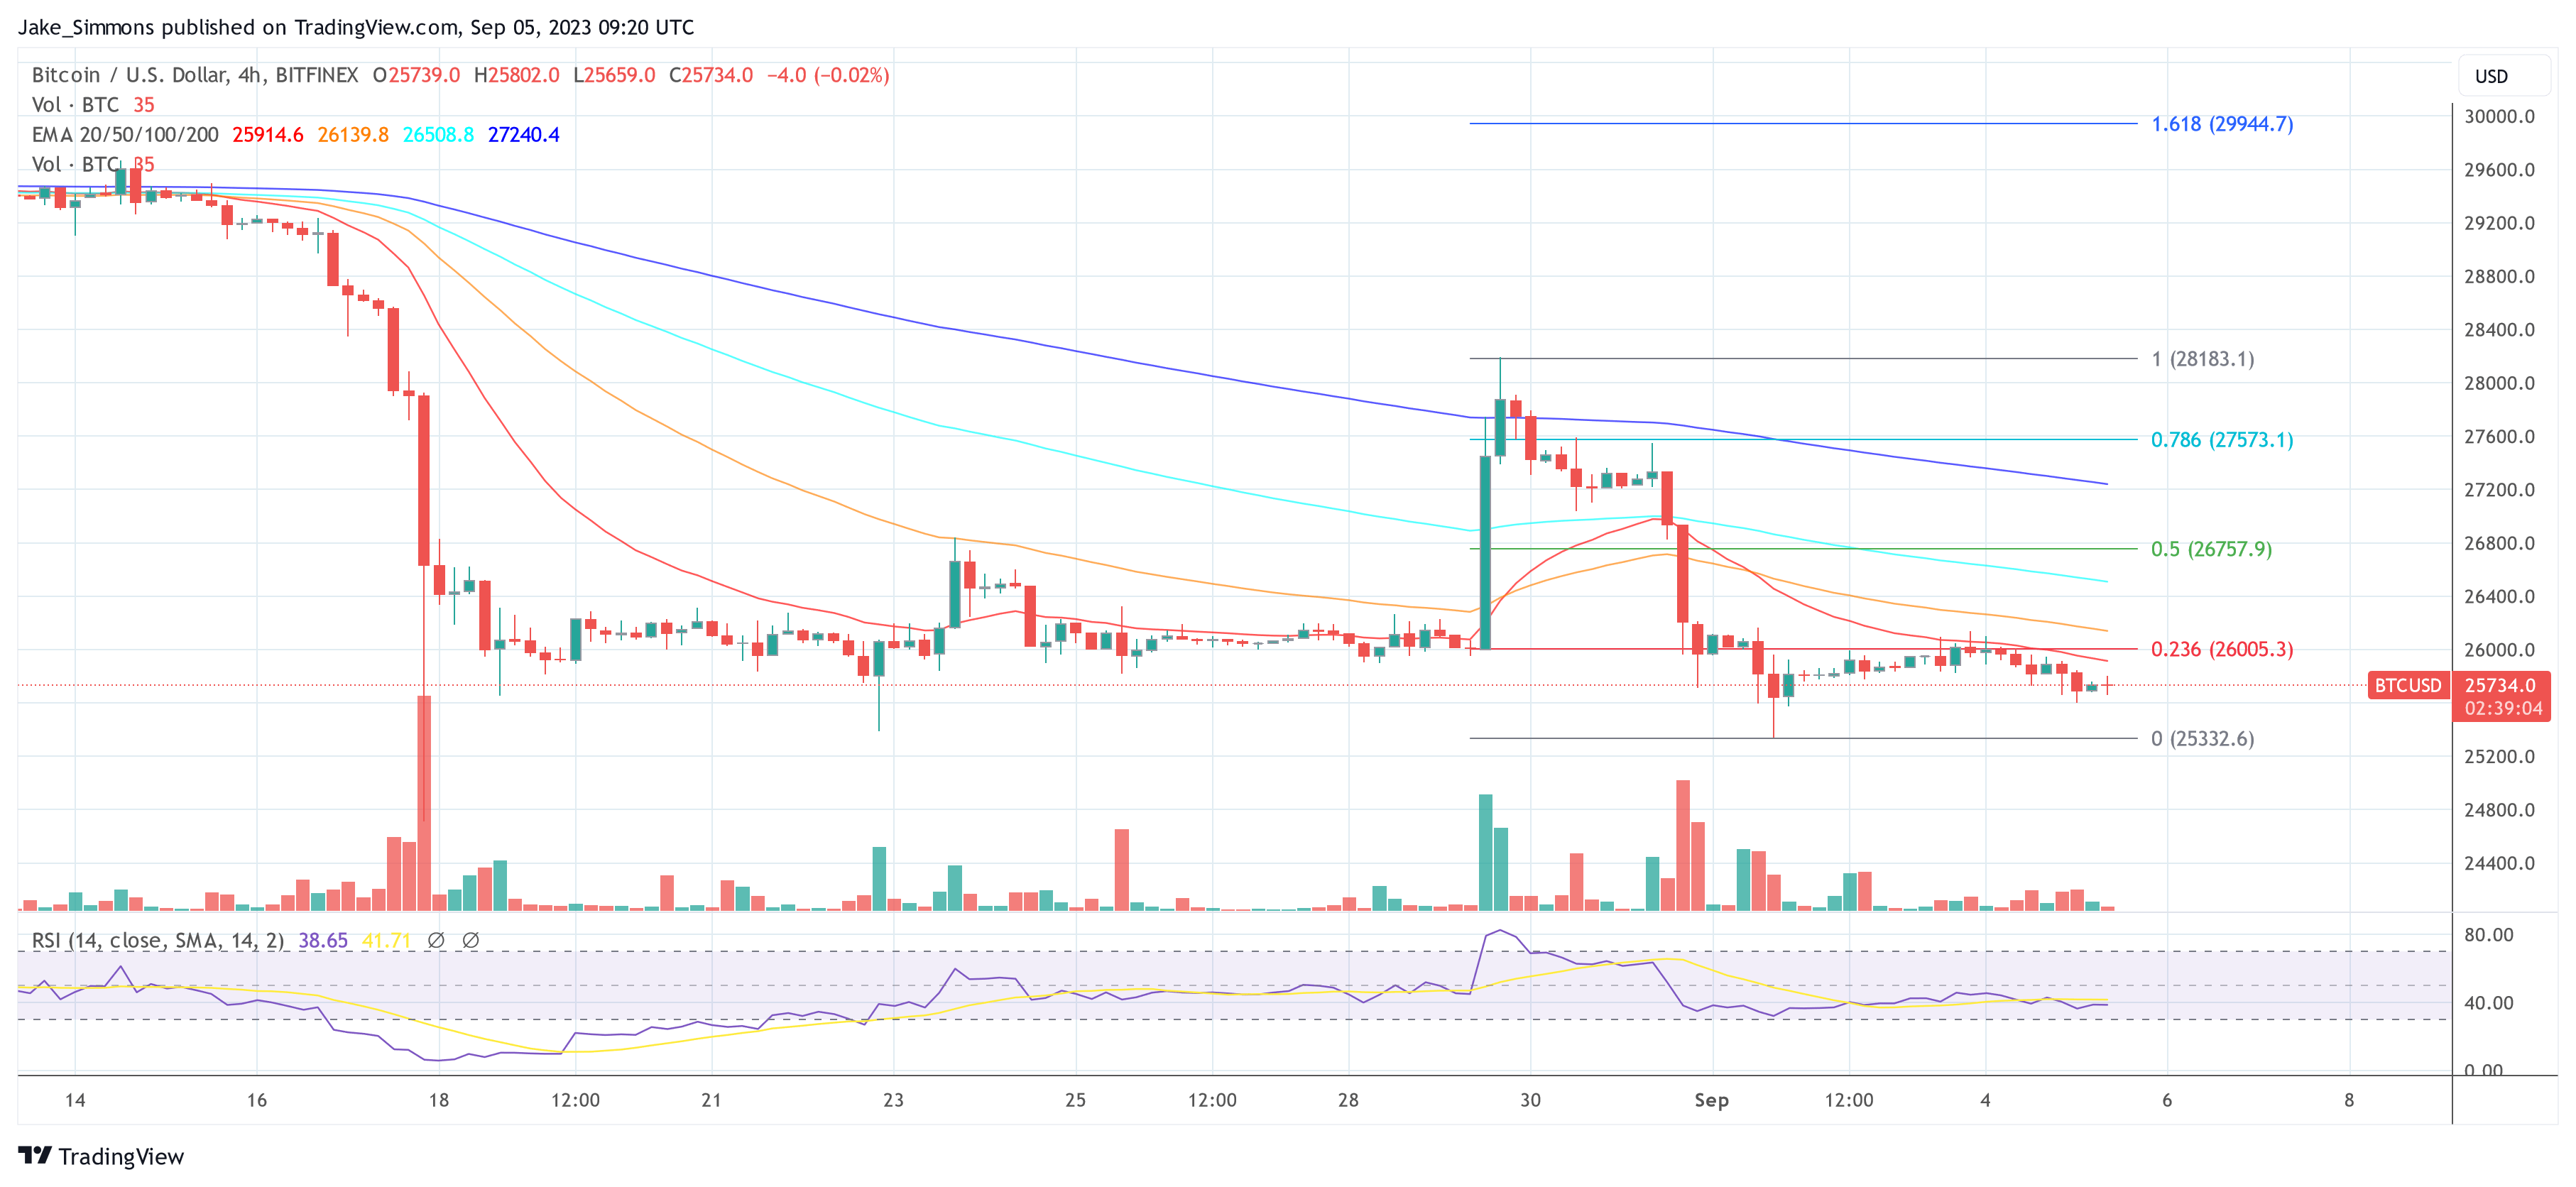
At press time, BTC traded at $25,734.
Featured image from Mike Doherty / Unsplash, chart from TradingView.com


