

Tron price is holding gains above $0.0825 against the US Dollar. TRX is outperforming Bitcoin and could rise further toward $0.095.
- Tron is moving higher above the $0.0825 resistance level against the US dollar.
- The price is trading above $0.0830 and the 100 simple moving average (4 hours).
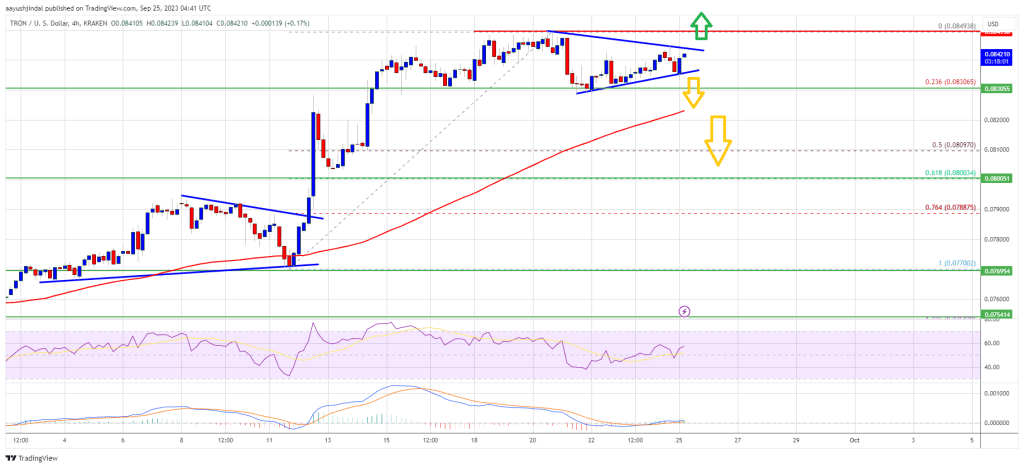
- There is a short-term contracting triangle forming with resistance near $0.0844 on the 4-hour chart of the TRX/USD pair (data source from Kraken).
- The pair could continue to climb higher toward $0.088 or even $0.095.
Tron Price Eyes Upside Break
In the last Tron price prediction, we discussed how TRX outperformed Bitcoin against the US Dollar. TRX remained stable and was able to settle above the $0.080 pivot level.
There was a decent increase above the $0.0825 and $0.0832 resistance levels. A high was formed near $0.0849 and the price recently corrected lower. There was a minor decline below the $0.0835 level. However, the bulls were active near the $0.0830 support.
The price found support near the 23.6% Fib retracement level of the upward move from the $0.0770 swing low to the $0.0849 high. TRX is now trading above $0.0825 and the 100 simple moving average (4 hours). There is also a short-term contracting triangle forming with resistance near $0.0844 on the 4-hour chart of the TRX/USD pair.
On the upside, an initial resistance is near the $0.0844 level. The first major resistance is near $0.0850, above which the price could accelerate higher. The next resistance is near $0.088.
Source: TRXUSD on TradingView.com
A close above the $0.088 resistance might send TRX further higher toward $0.0920. The next major resistance is near the $0.095 level, above which the bulls are likely to aim for a larger increase toward $0.095.
Are Dips Limited in TRX?
If TRX price fails to clear the $0.085 resistance, it could slowly move lower. Initial support on the downside is near the $0.083 zone. The first major support is near the $0.082 level or the 100 simple moving average (4 hours).
The next major support is near $0.080 or the 61.8% Fib retracement level of the upward move from the $0.0770 swing low to the $0.0849 high, below which the price could accelerate lower. The next major support is $0.0770.
Technical Indicators
4 hours MACD – The MACD for TRX/USD is gaining momentum in the bullish zone.
4 hours RSI (Relative Strength Index) – The RSI for TRX/USD is currently above the 50 level.
Major Support Levels – $0.083, $0.082, and $0.080.
Major Resistance Levels – $0.085, $0.088, and $0.095.

