Bitcoin (BTC) could be forming a so-called “double top” pattern after falling by over 30% from its record high of $69,000, suggests Peter Brandt, a veteran trader known for correctly calling the crypto market top in December 2017.
The bubble has been popped. Bull market in $BTC over for some time. For analog look at Gold chart from 2011 on wards pic.twitter.com/AUSiGH0eCg
— Peter Brandt (@PeterLBrandt) December 22, 2017
The Factor LLC CEO recalled Bitcoin’s inability to extend its price rally above its previous all-time high near $65,000 after a second try. Meanwhile, he illustrated an immediate support level for the BTC price at a so-called neckline near $30,000 while alerting about further declines below this key level.
Is a 50% Bitcoin price crash realistic?
In detail, traditional chartists perceive the formation of two consecutive tops, each leading to a strong price retracement to the downside, as a sign of bearish reversal. The downside target in a double top scenario comes to be approximately as deep as the height of the pattern’s formation.
But the double top downside target is somewhat unrealistic here because confirmation of the pattern would suggest a nearly $35,000 decline in Bitcoin price. Meaning, BTC price would be at risk of crashing below $0 in a perfect world, a scenario which is highly unlikely.
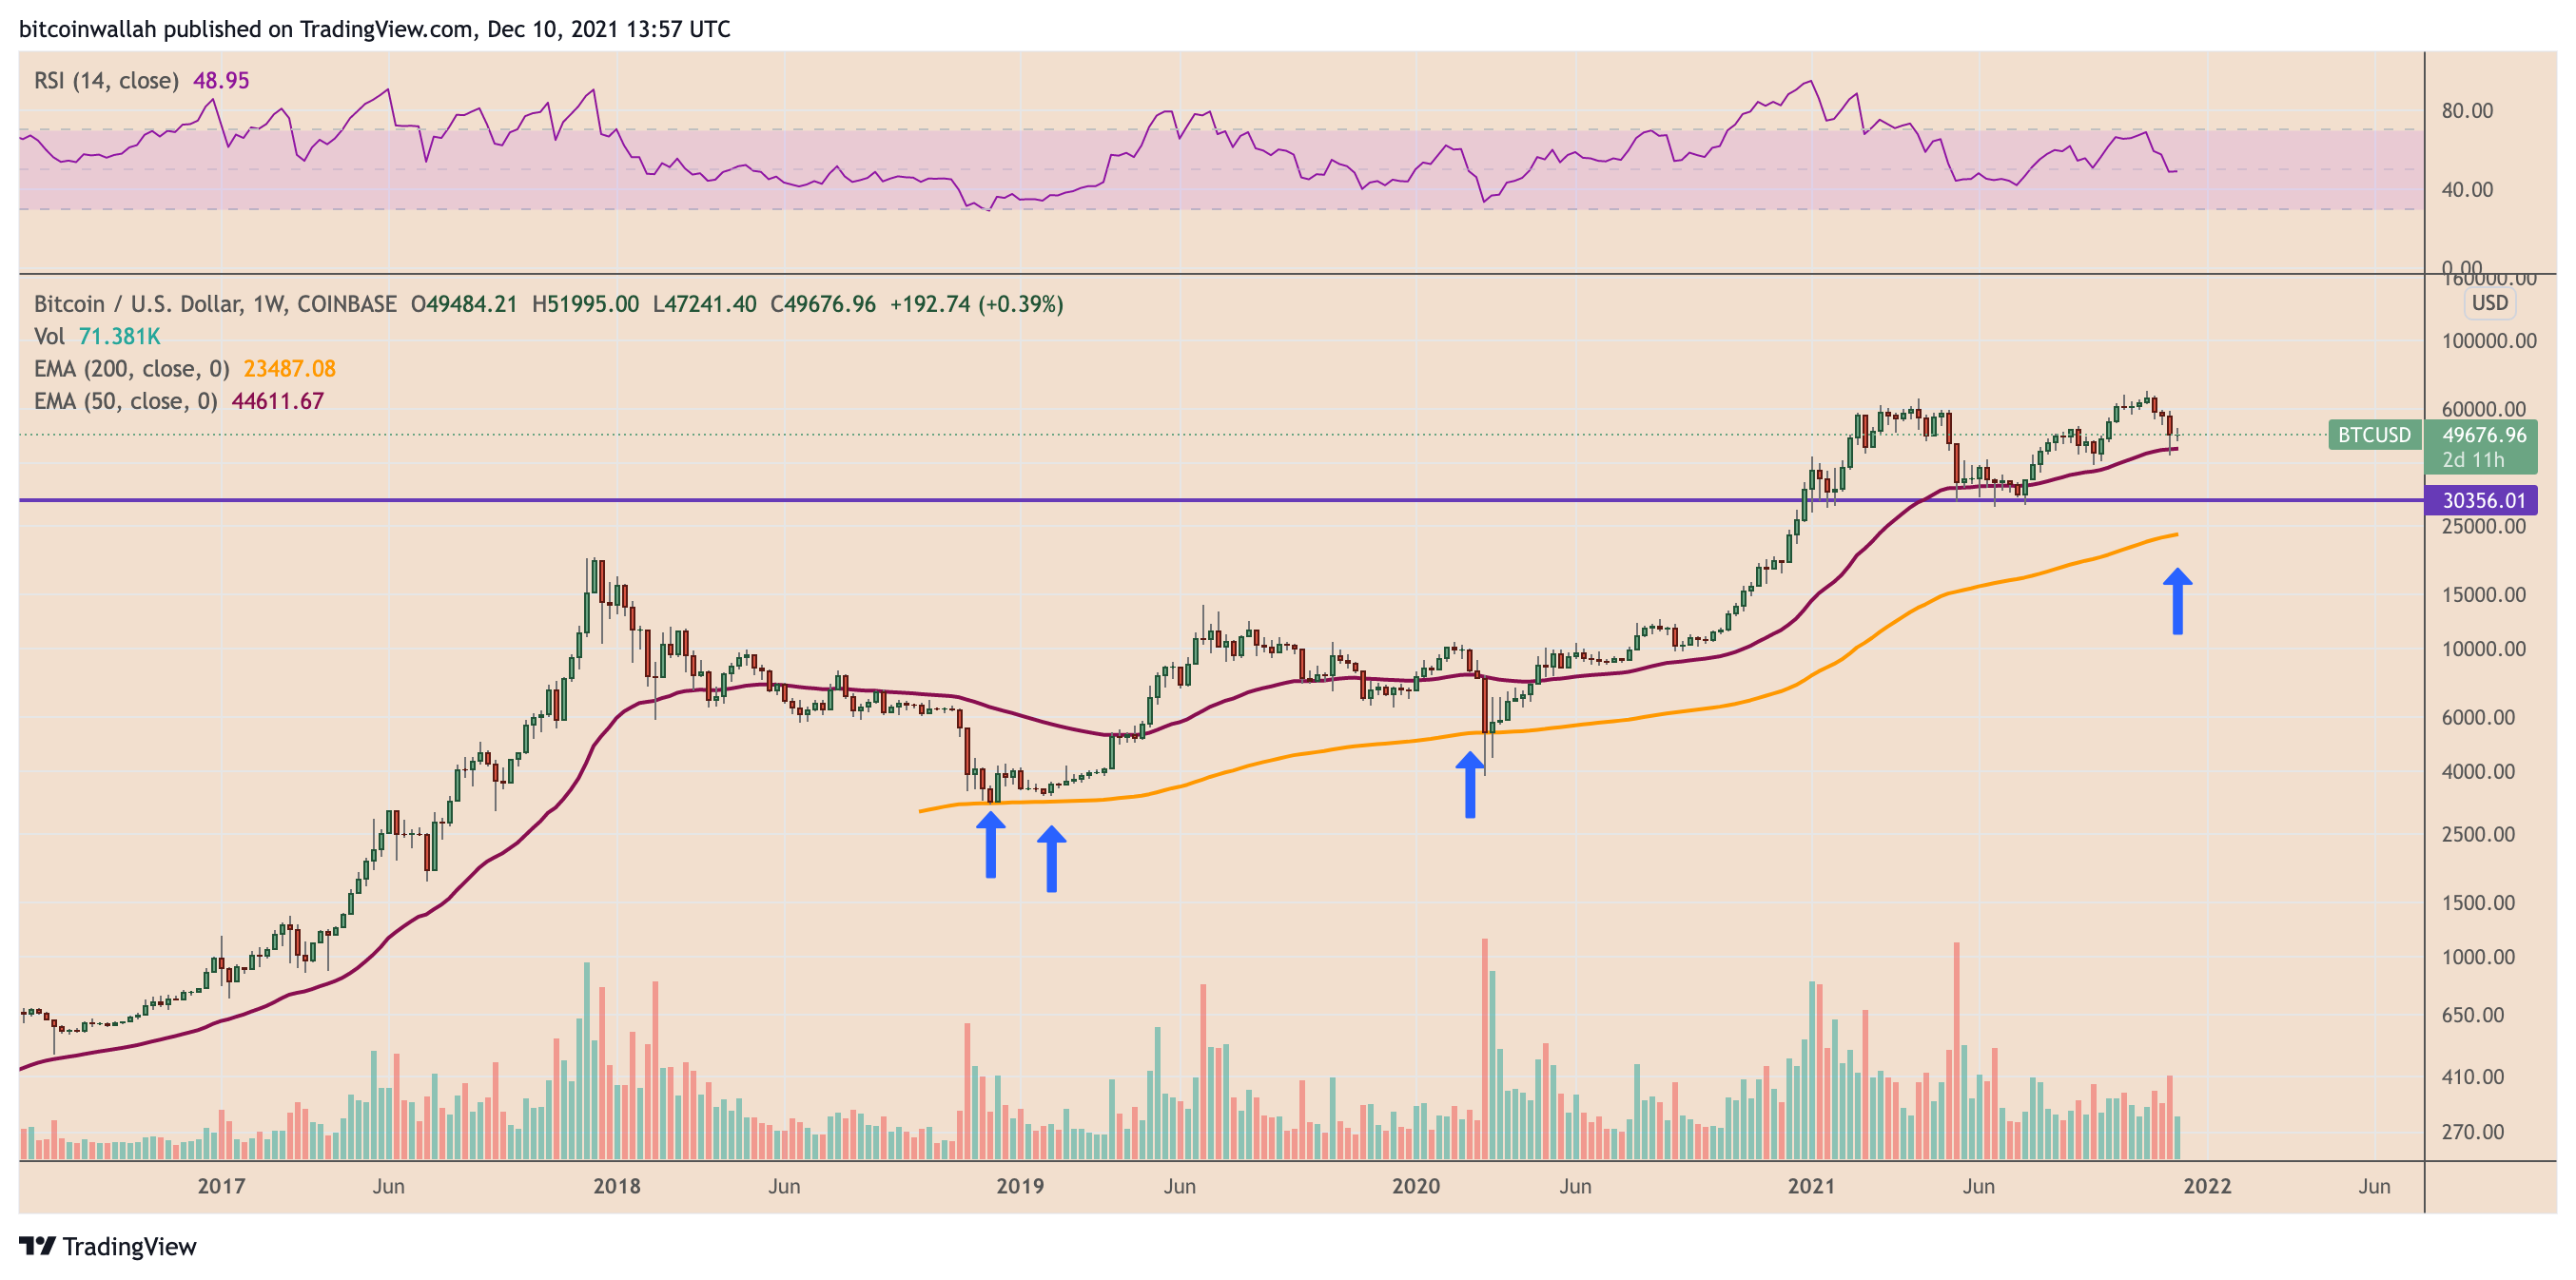
Nonetheless, should the price break bearish below the neckline of $30,000, Bitcoin’s ultimate downside target may turn out to be the 200-week exponential moving average (200-week EMA; the orange wave in the chart below), currently about 50% below the current price levels, near $23,500.

The 200-week EMA has been instrumental in calling out the bottoms in a bear market, as shown by the upward-pointing arrows in the chart above. However, Brandt reminded:
“A chart pattern is NOT NOT NOT a chart pattern until it is completed and confirmed. Until that time it is only of passing interest to me.”
Just another BTC price dip?
Ignoring the potential bearish outlooks, Bitpanda’s chief product officer Lukas Enzersdorfer-Konrad asserted that Bitcoin’s price decline from $69,000 to $42,000 is similar to its May 2021 price crash, wherein it plunged by over 50%, only to pare all those losses and hit a new record high later.
“Similarly to the recent drop, overleveraged positions increased volatility and wiped away most of the long positions,” Enzersdorfer-Konrad told Cryptox in a statement via email as he referred to the $2.5 billion worth of liquidation in a matter of hours on Dec. 4, which caused around 20% intraday correction in most liquid crypto assets.
The analyst added:
“The Bitcoin market needs some time to recover in these situations, and intraday charts are still volatile, but it is still bullish on the higher time frame.”
Related: Bitcoin tumbles below $47K wiping out October gains — Bear market begins?
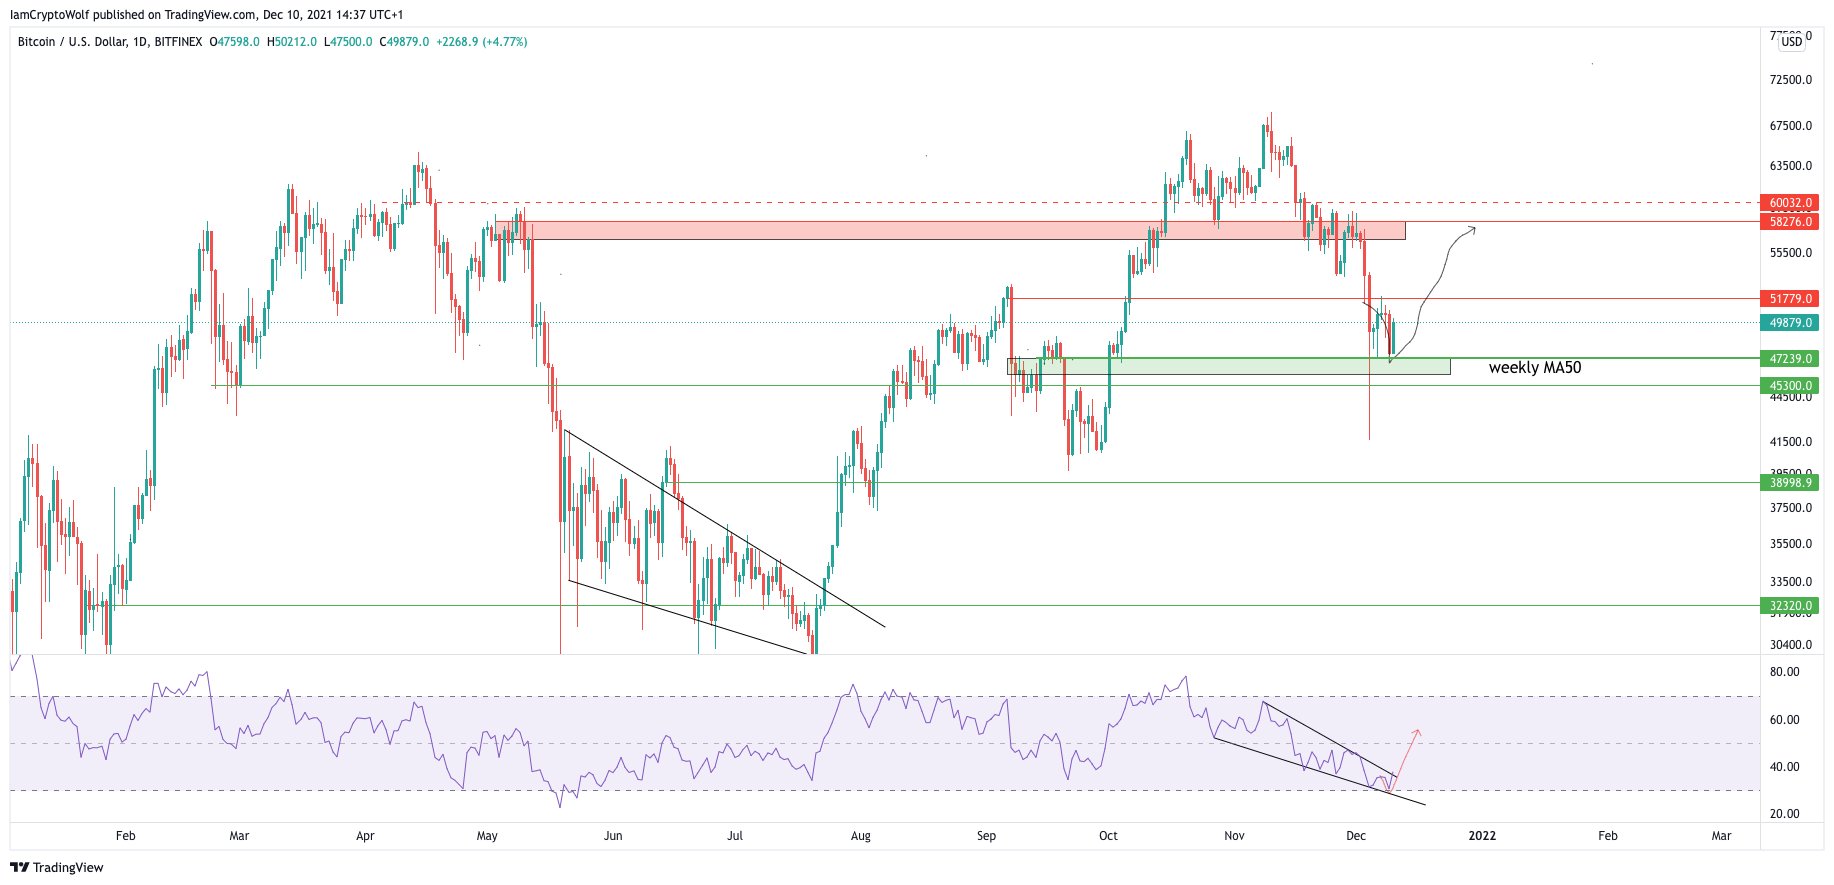
From a bullish technicals standpoint, one popular independent market analyst known by the pseudonym “Wolf,” presented Bitcoin as an oversold asset based on its relative strength index (RSI) readings on a daily-timeframe chart.

Wolf anticipated the BTC price to test $51,780 as its next resistance level, with an extended upside target at near $60,000.
The views and opinions expressed here are solely those of the author and do not necessarily reflect the views of Cryptox.com. Every investment and trading move involves risk, you should conduct your own research when making a decision.


