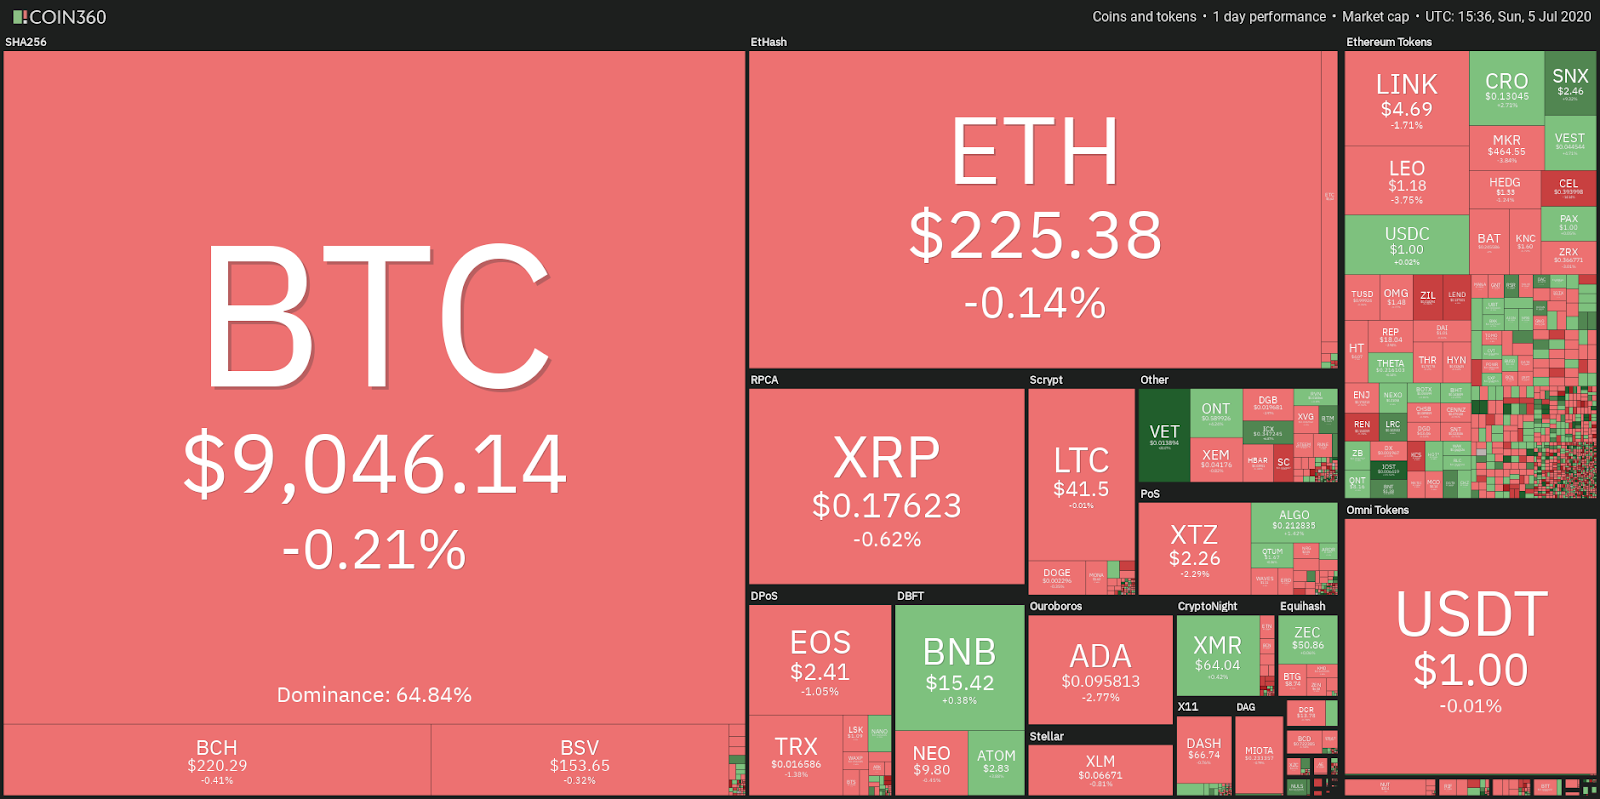
Bitcoin and most altcoins are witnessing selling at every minor rally, increasing the possibility of a dip in the short-term.
Bridgewater CIO Ray Dalio said that central banks have moved away from their traditional role and have become owners of assets since the 2008 Financial crisis. They now act as “market makers.” Therefore, the “capital markets are not free” anymore.
Dalio warned that the US dollar is likely to lose its attractiveness as the reserve currency of the world.
Crypto market data daily view. Source: Coin360
However, it will be a while before the current economic system crumbles due to the measures taken by the central banks. Until the majority do not realize that money printing cannot be the solution for every problem, institutional investment is only likely to slowly trickle into the crypto space.
The investments are likely to surge when the realization hits that the U.S. dollar and other fiat currencies are flawed. That will boost crypto prices and result in a massive bull market.
BTC/USD
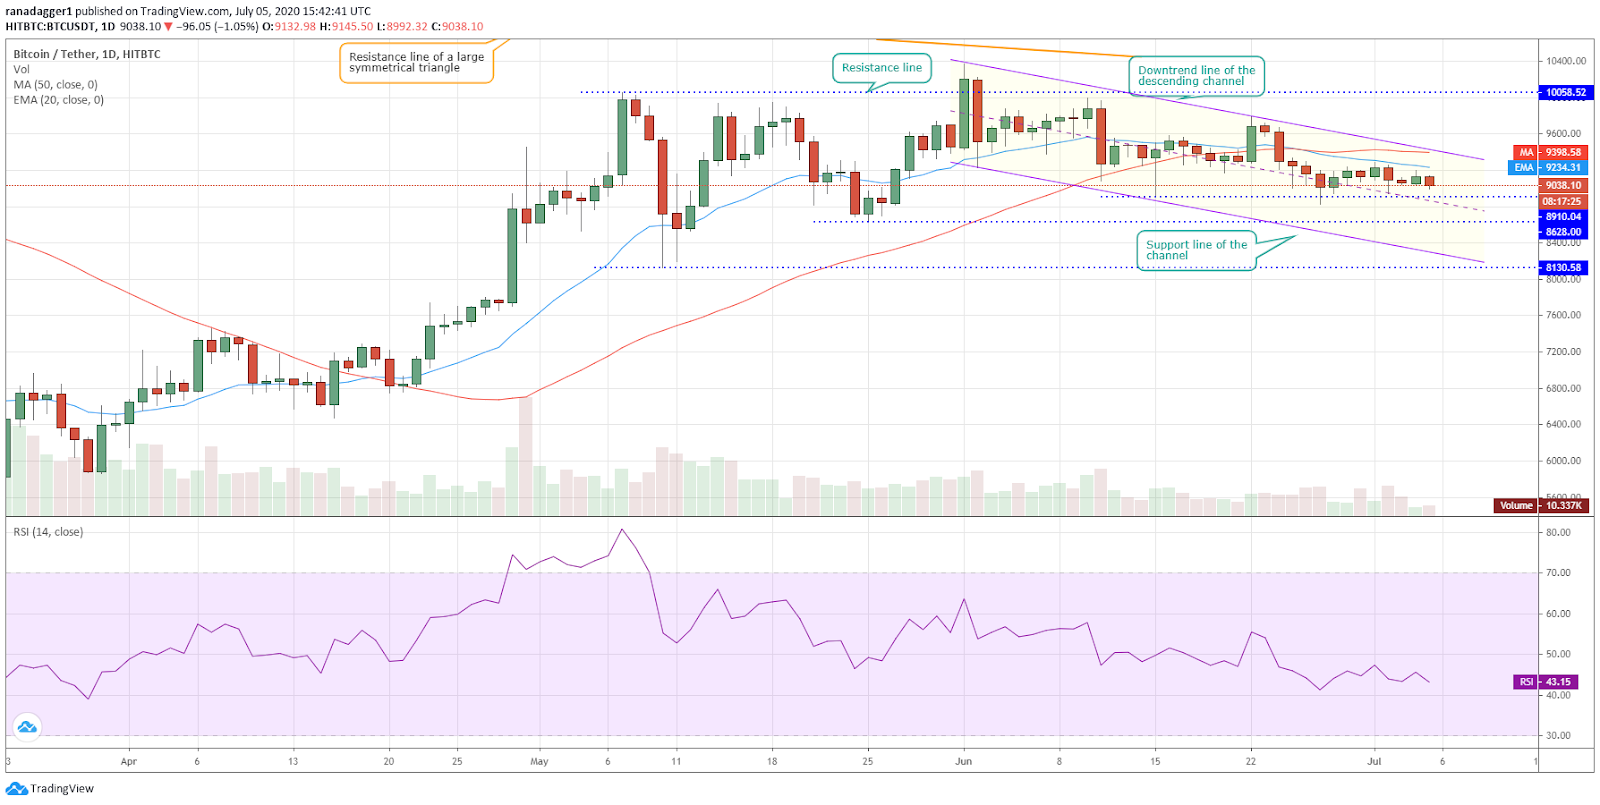
The relief rally in Bitcoin (BTC) could not rise above the 20-day exponential moving average ($9,234) on July 1 and 2, which is a negative sign as it shows that bears are aggressively defending this resistance level.
BTC/USD daily chart. Source: Tradingview
If the bears now sink the top-ranked cryptocurrency on CoinMarketCap below the immediate support zone of $8,910.04-$8,825, a decline to $8,628 is possible. Such a move will indicate that the bears are selling at every available opportunity.
Below $8,628, the decline can extend to $8,130.58, which is likely to act as critical support. A strong bounce off this support could offer a buying opportunity to the traders. Conversely, if the bears sink the BTC/USD pair below $8,130.58, a new downtrend is likely to start.
Currently, the 20-day EMA is sloping down gradually and the relative strength index has been trading below 50 for the past few days, suggesting an advantage to the bears. A relief rally from the current levels is likely to face resistance at the 50-day simple moving average ($9,398).
A breakout of the downtrend line of the descending channel will be the first indication that the bulls are making a comeback.
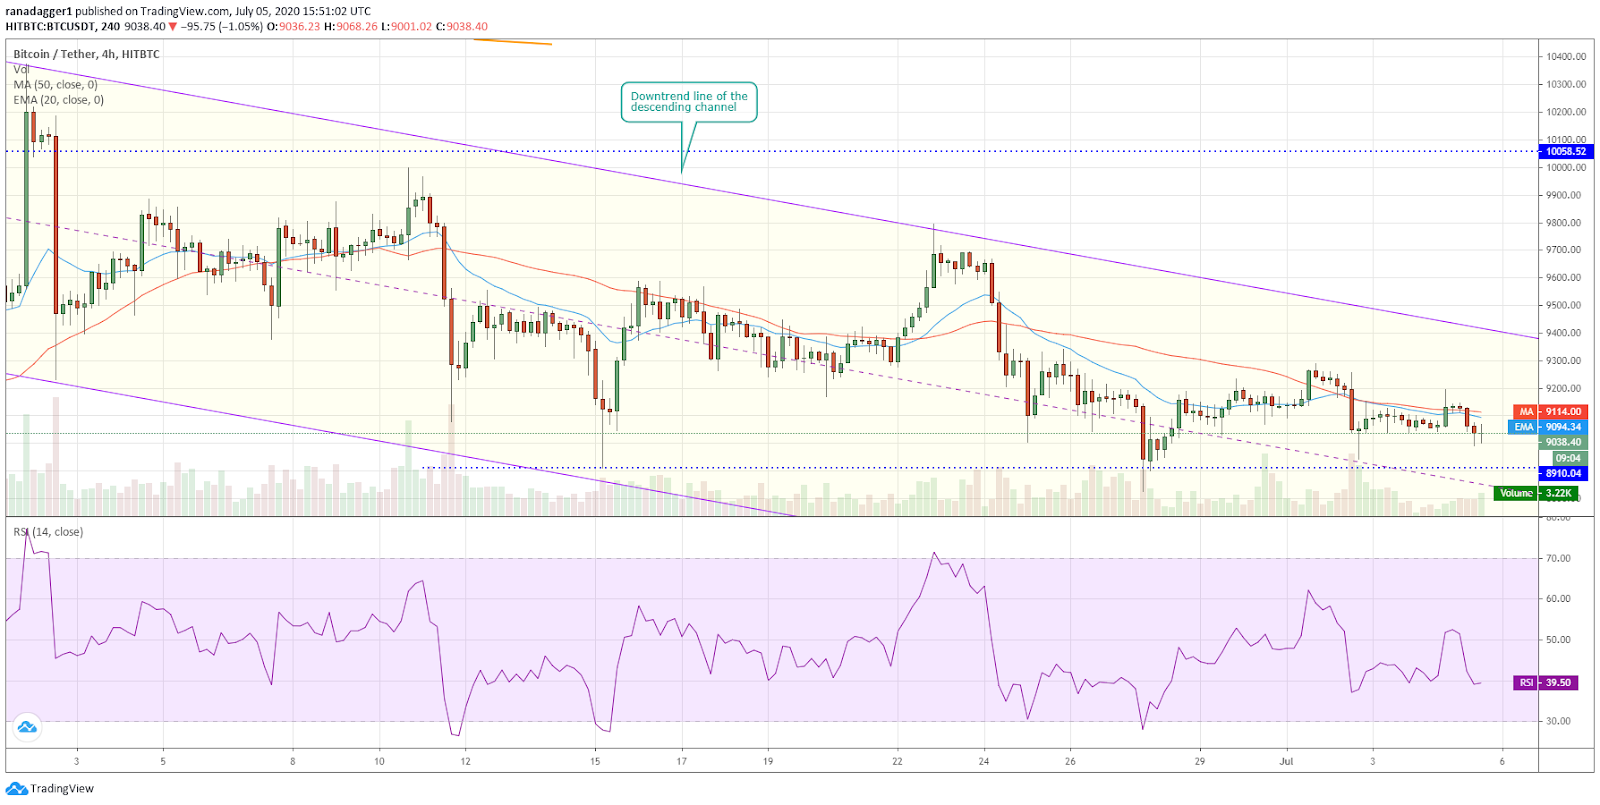
BTC/USD 4-hour chart. Source: Tradingview
Both moving averages are sloping down on the 4-hour chart and the RSI has dipped below the 40 level, which suggests that bears have the upper hand in the short-term.
If the price dips to $8,910.04, this will be the fourth retest of this support level. Usually, when a support level is tested repeatedly, it tends to weaken. A strong break below this level could open up shorting opportunities to the traders.
However, if the pair rebounds off the $8,910.04 level, the bulls will try to push the price above the downtrend line of the channel. On a close (UTC time) above the channel, the short-term trend might shift in favor of the bulls with the first target objective of $9,800 followed by a retest of $10,058.52.
NEO/USD
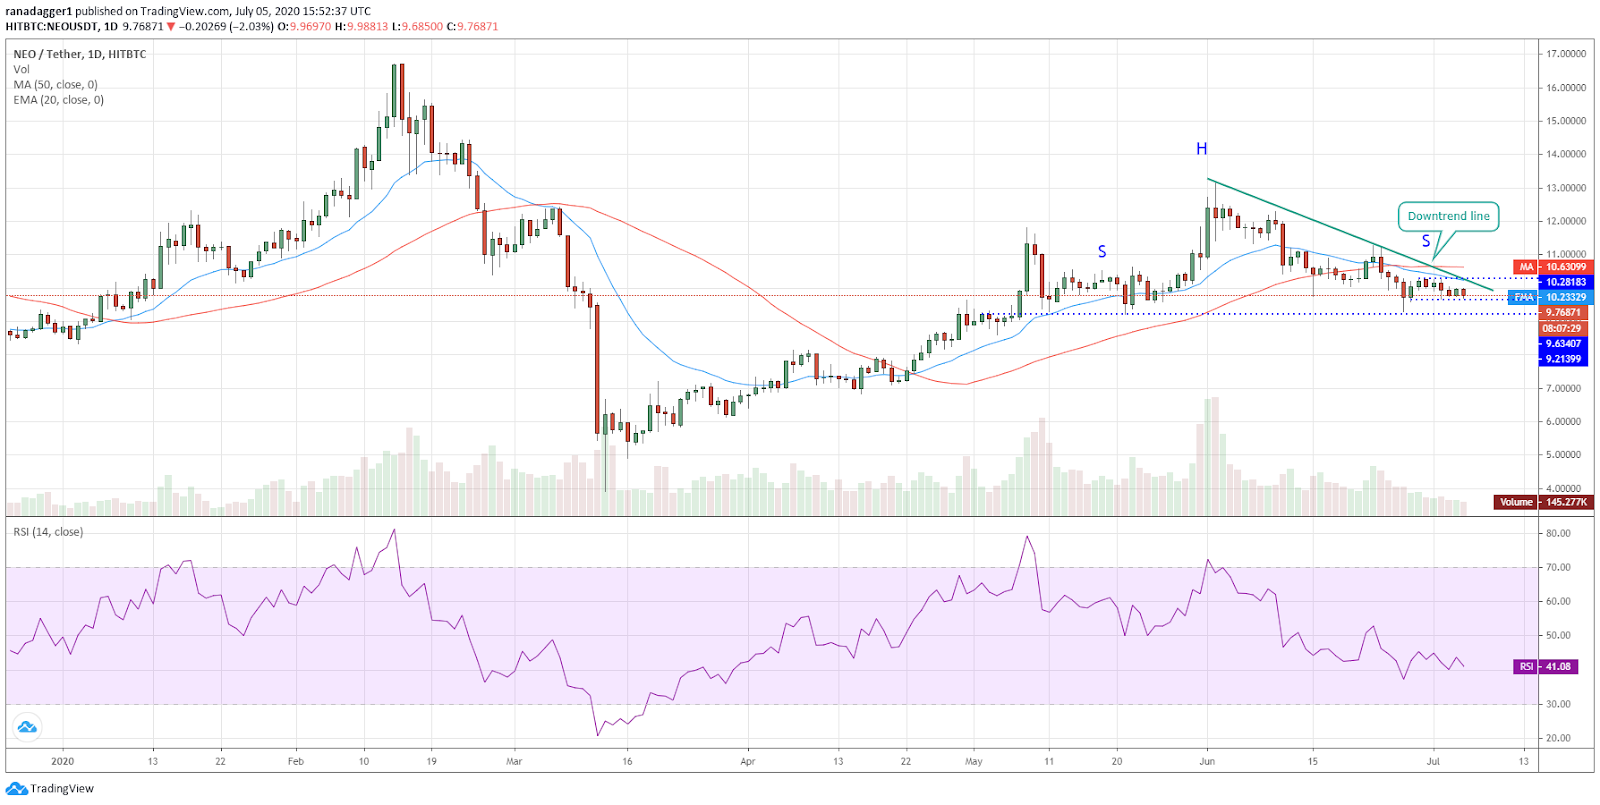
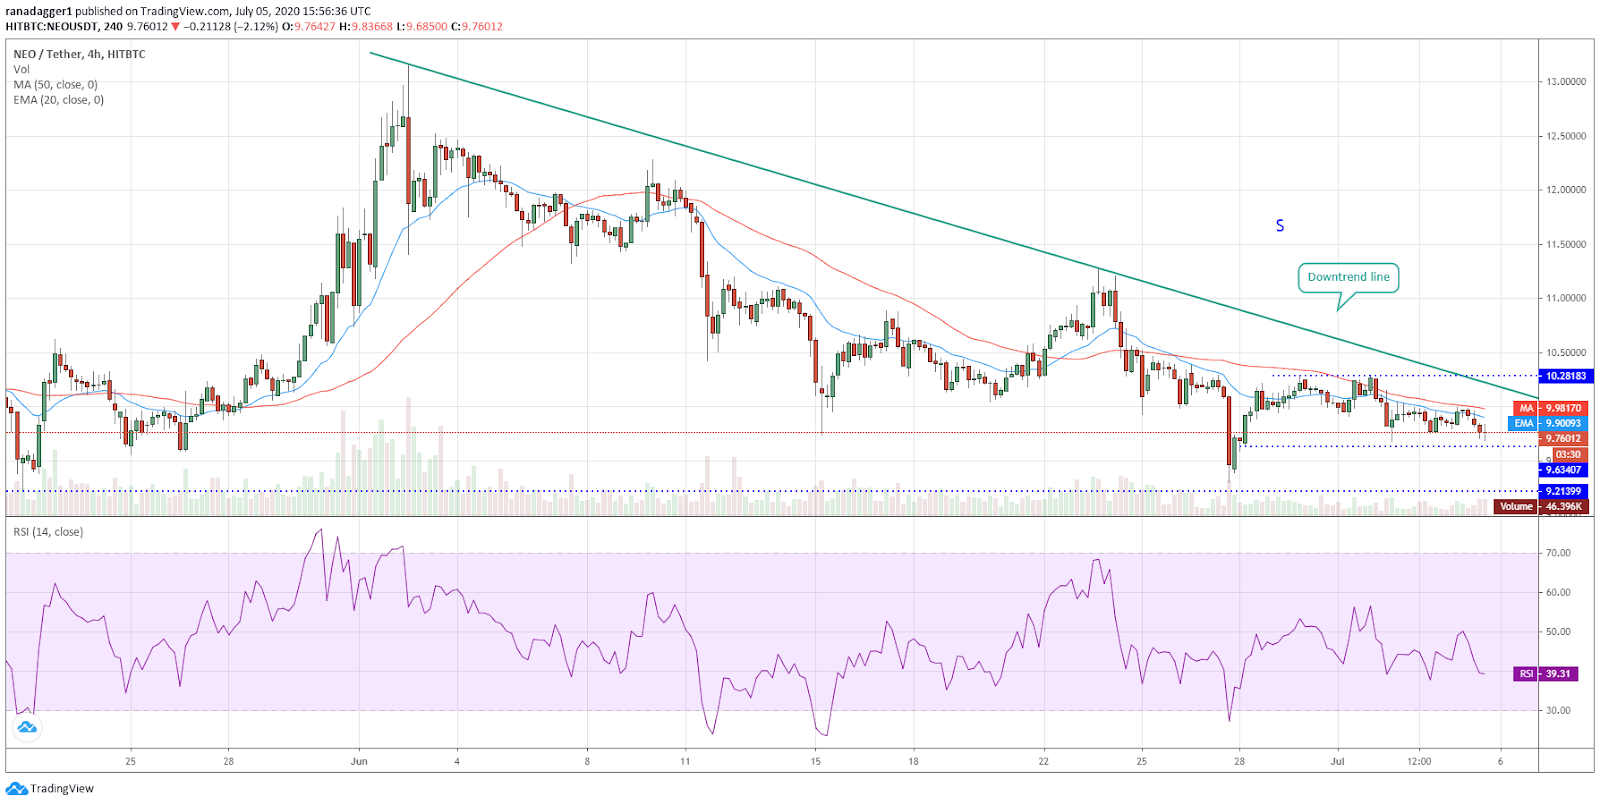
The rebound off the critical $9.21399 support could not even touch the 20-day EMA ($10.23), which shows that the bulls are not in a hurry to buy NEO at higher levels as they are not confident that a bottom is in place.
NEO/USD daily chart. Source: Tradingview
The 20-day EMA is sloping down and the RSI is close to the 40 level, suggesting that bears have the upper hand. They will once again attempt to sink the 21-ranked cryptocurrency on CoinMarketCap below $9.21399.
If the bears succeed, a close (UTC time) below $9.21399 will complete a bearish head and shoulders pattern that has a target objective of $5.25687. However, it is unlikely to be a straight fall to the target as the bulls will try to stall the decline at $7.
This bearish view will be invalidated if the price again rebounds off the $9.21399 support and rises above the 50-day SMA ($10.63).
NEO/USD 4-hour chart. Source: Tradingview
Both moving averages are sloping down and the RSI is comfortably in the negative zone, which shows that bears have the upper hand. A break below $9.63407 will increase the possibility of a fall to $9.21399.
This is a critical level to watch out for because the bulls will try to defend it while the bears will want to break below it to start the downtrend.
If the bulls buy the dip and push the NEO/USD pair above $10.28183, the short-term bearish sentiment might be over.
However, if the bears can break and close (UTC time) below $9.21399, a new downtrend is likely. There is a minor support at $8.60349 and below that at $8.16228. But if both these supports are broken, a drop to $7 is possible.
TRX/USD
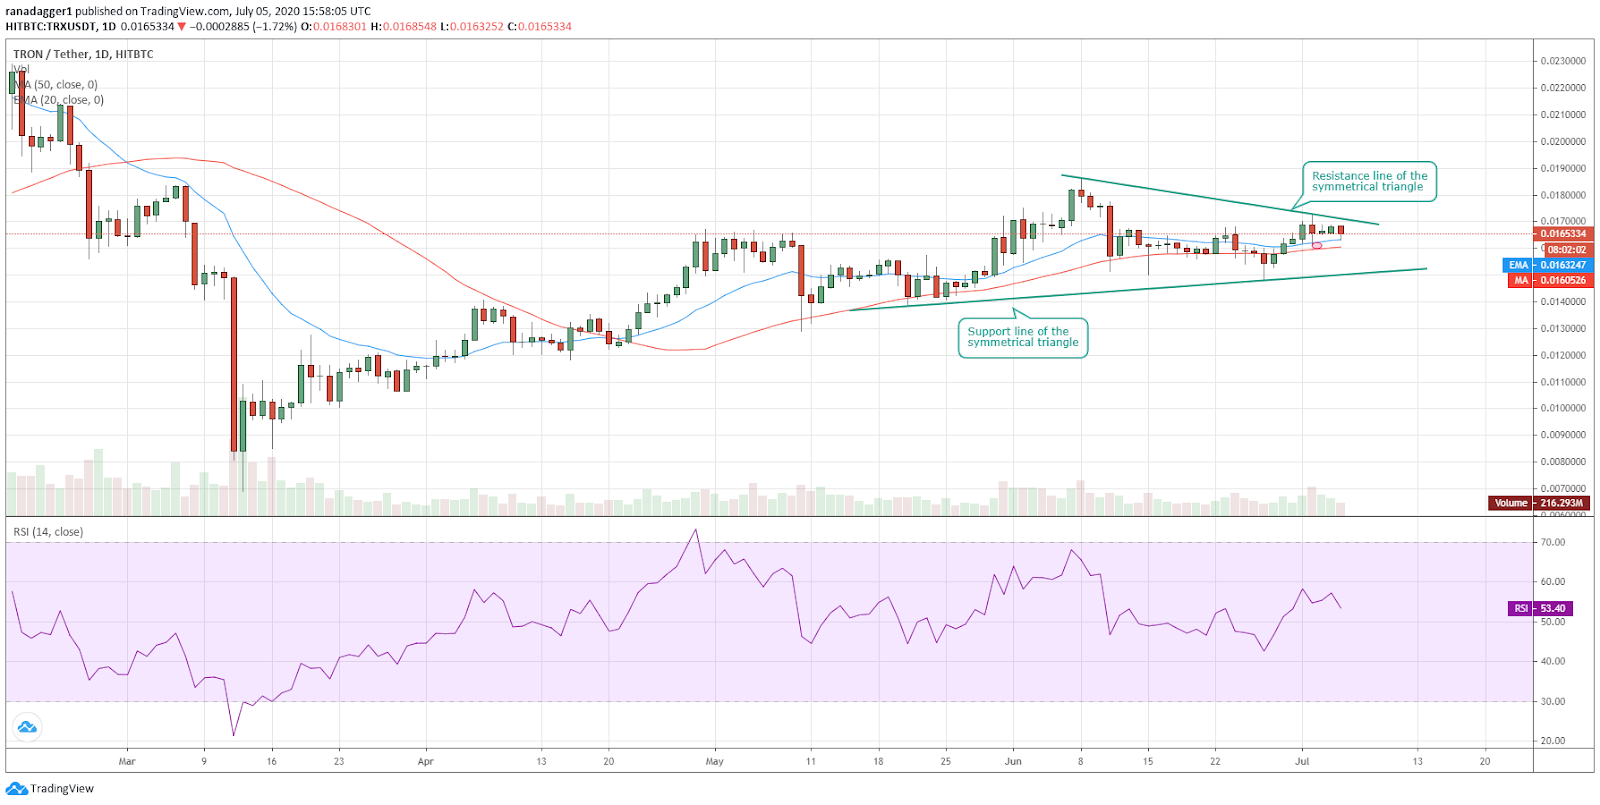
Tron (TRX) is currently trading inside a symmetrical triangle, which generally behaves as a continuation pattern. However, it is best to wait for the breakout to happen before initiating a trade because sometimes, the symmetrical triangle can also act as a reversal pattern.
TRX/USD daily chart. Source: Tradingview
If the bulls can propel the 17th-ranked cryptocurrency on CoinMarketCap above the resistance line of the triangle, it will signal strength. The first target is $0.01864 and if this level is scaled, a rally to the pattern target of $0.0217882 is possible.
However, if the price turns down from the current levels and breaks below the moving averages, it will signal weakness. In such a case, a drop to the support line of the triangle is likely.
A break below the triangle can drag the price to $0.012 and if this support is also broken, the decline could extend to the pattern target at $0.0102118.
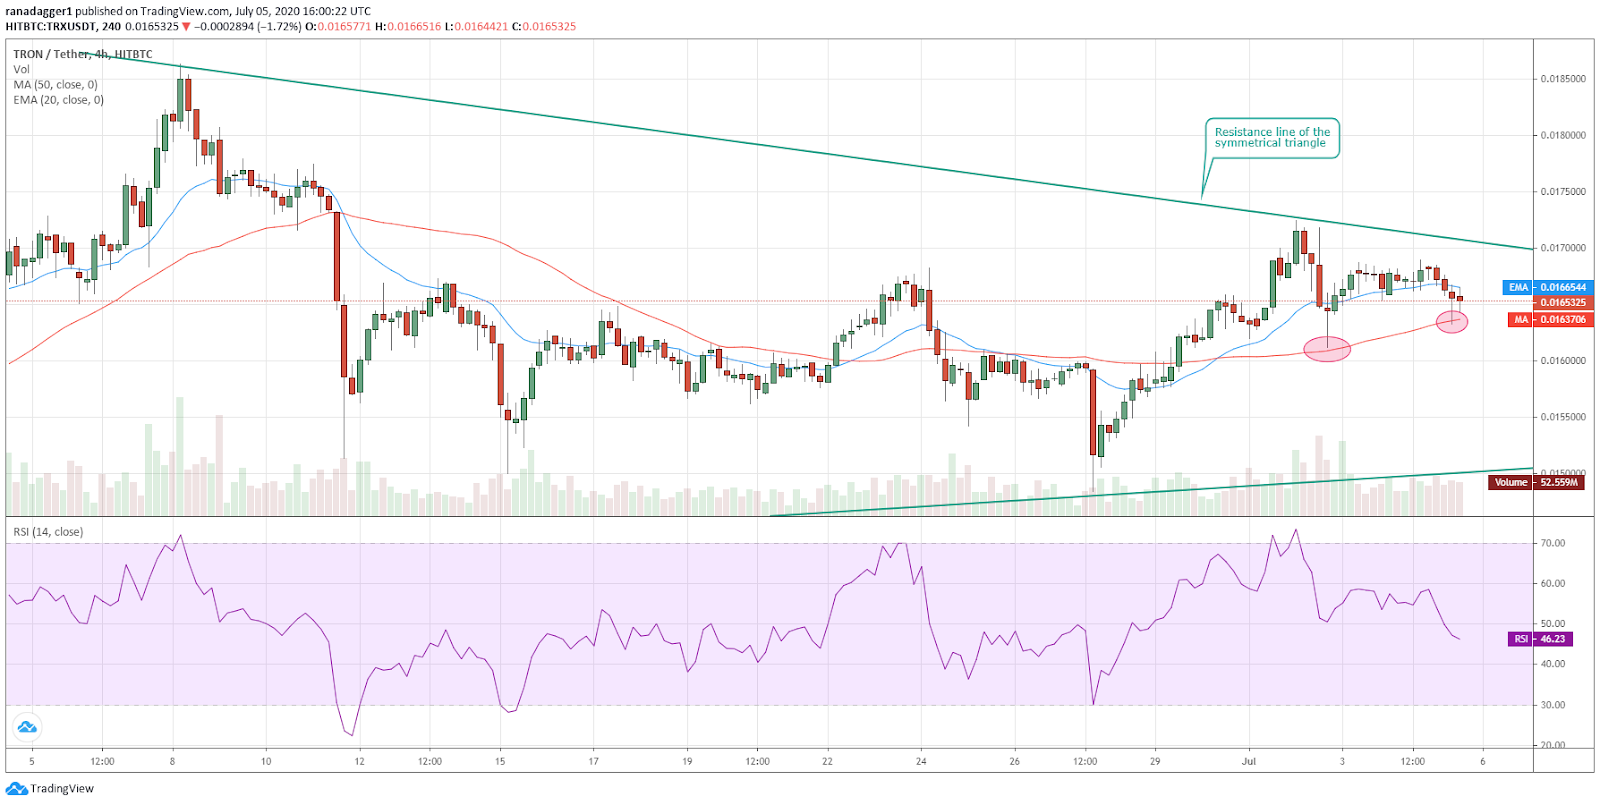
TRX/USD 4-hour chart. Source: Tradingview
The long wicks on the candles close to the 50-SMA (marked as ellipse on the chart) show that the bulls are aggressively attempting to defend this support.
If the bulls can carry the current bounce above the resistance line of the symmetrical triangle, a rally to $0.0177451 and then to $0.01864 is possible.
This bullish view will be invalidated if the bears can sink the TRX/USD pair below the 50-SMA. If that happens, it is likely to attract further selling resulting in a drop to the support line of the triangle.
XTZ/USD
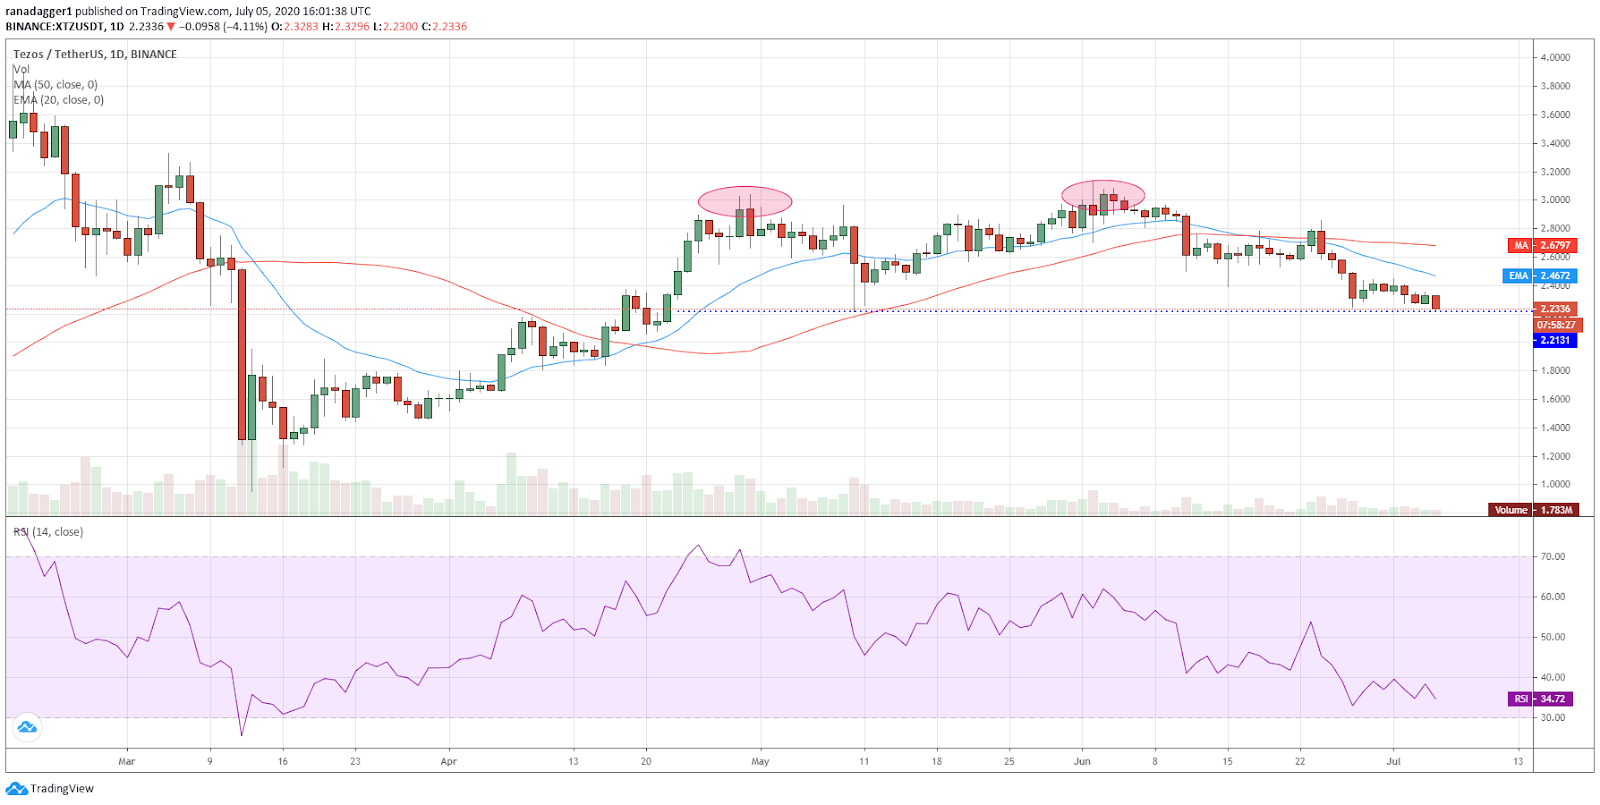
Tezos (XTZ) bounced from close to the critical support of $2.2131 on June 27. But the bulls could not even carry the price to the 20-day EMA ($2.46), which shows a lack of demand at higher levels.
XTZ/USD daily chart. Source: Tradingview
The 12th-ranked cryptocurrency on CoinMarketCap has again dipped back to the $2.2131 support. If this support gives way, it is likely to attract further selling.
A close (UTC time) below the support will complete a double top pattern, which has a target objective of $1.2945.
The 20-day EMA is sloping down and the RSI is close to the oversold zone, which indicates that bears have the upper hand.
This bearish view will be invalidated if the rebound off the current levels rises above the 20-day EMA.
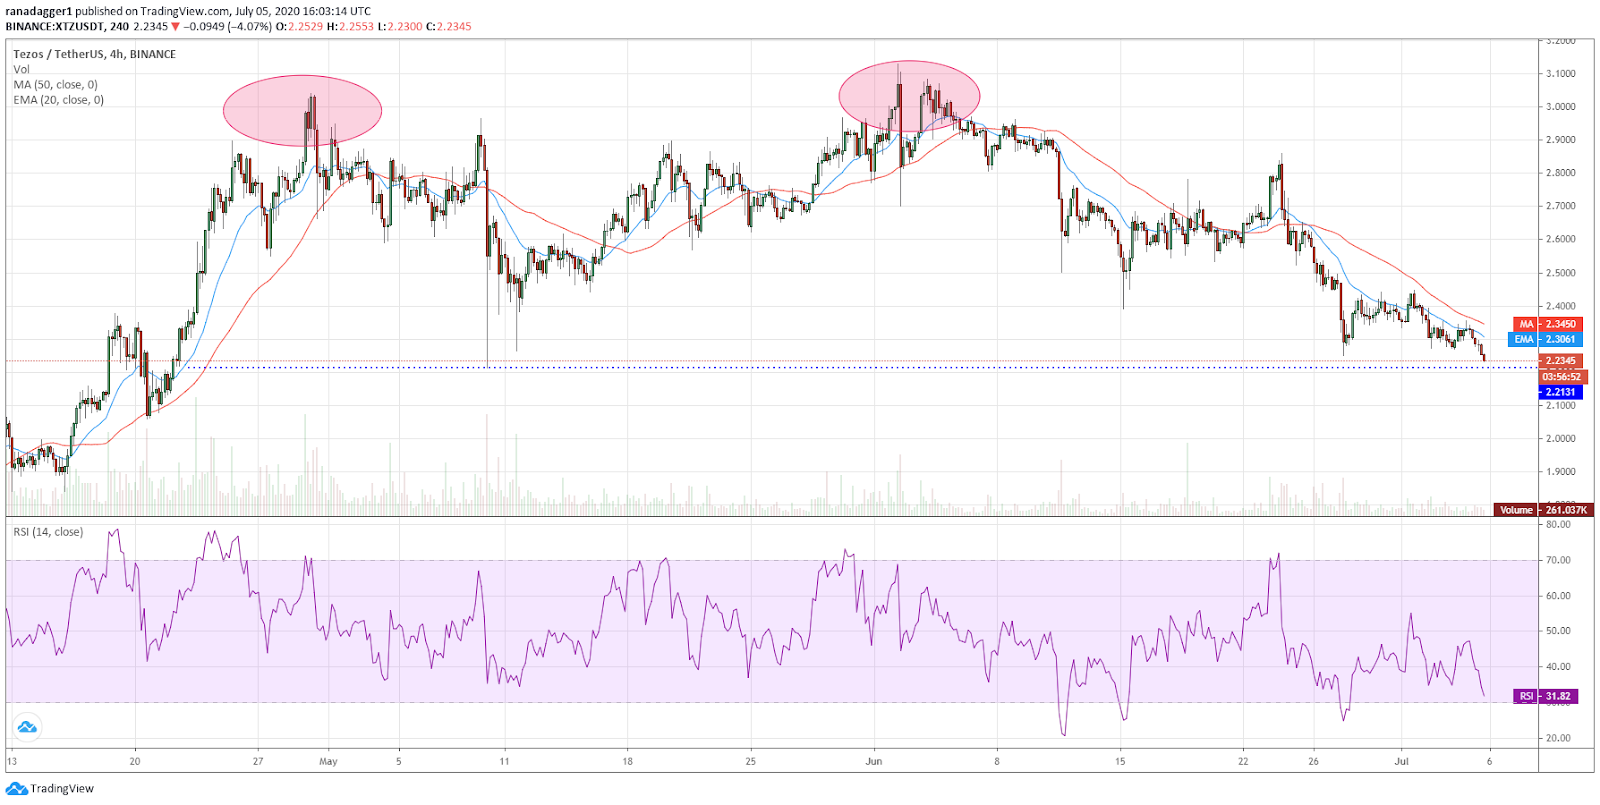
XTZ/USD 4-hour chart. Source: Tradingview
The 4-hour chart shows that the bears are aggressively defending the 50-SMA. Both moving averages are sloping down and the RSI is in the negative zone, which shows that bears have the upper hand.
If the bears can break below the critical support at $2.2131, a drop to $2.0581 and then to $1.80 is likely. This bearish view will be invalidated if the bulls can push the XTZ/USD pair above the 50-SMA.
VET/USD
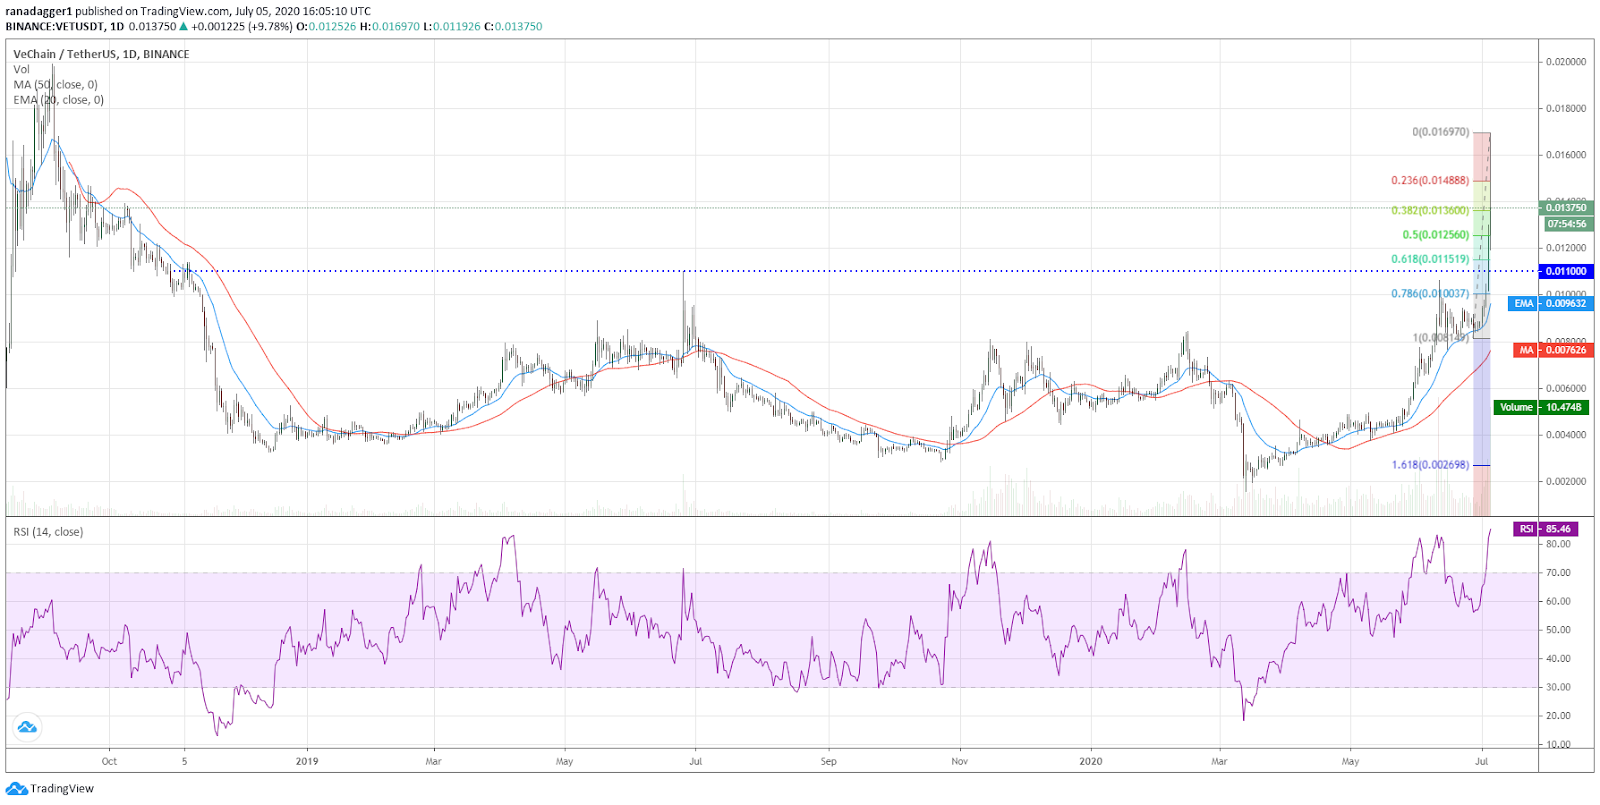
VeChain (VET) had been in a bottoming formation for over one and a half years. On July 4, the bulls pushed the price above the overhead resistance of $0.011, suggesting the start of a new uptrend. The target objective of this breakout is $0.020.
VET/USD daily chart. Source: Tradingview
Currently, the 20th-ranked cryptocurrency on CoinMarketCap is facing selling at higher levels. Usually, a breakout from a long consolidation corrects and retests the breakout level but sometimes, if the momentum is strong, the pullback might be shallow.
In this case, the breakout level is $0.011 but it is not necessary that the price will drop to this level. The pullback is likely to find buyers at $0.01256 and below that at $0.011519, which are 50% and 61.8% Fibonacci retracement levels of the most recent leg of the up move.
The bullish view will be invalidated if the bears sink the price below the breakout level of $0.011.
VET/USD 4-hour chart. Source: Tradingview
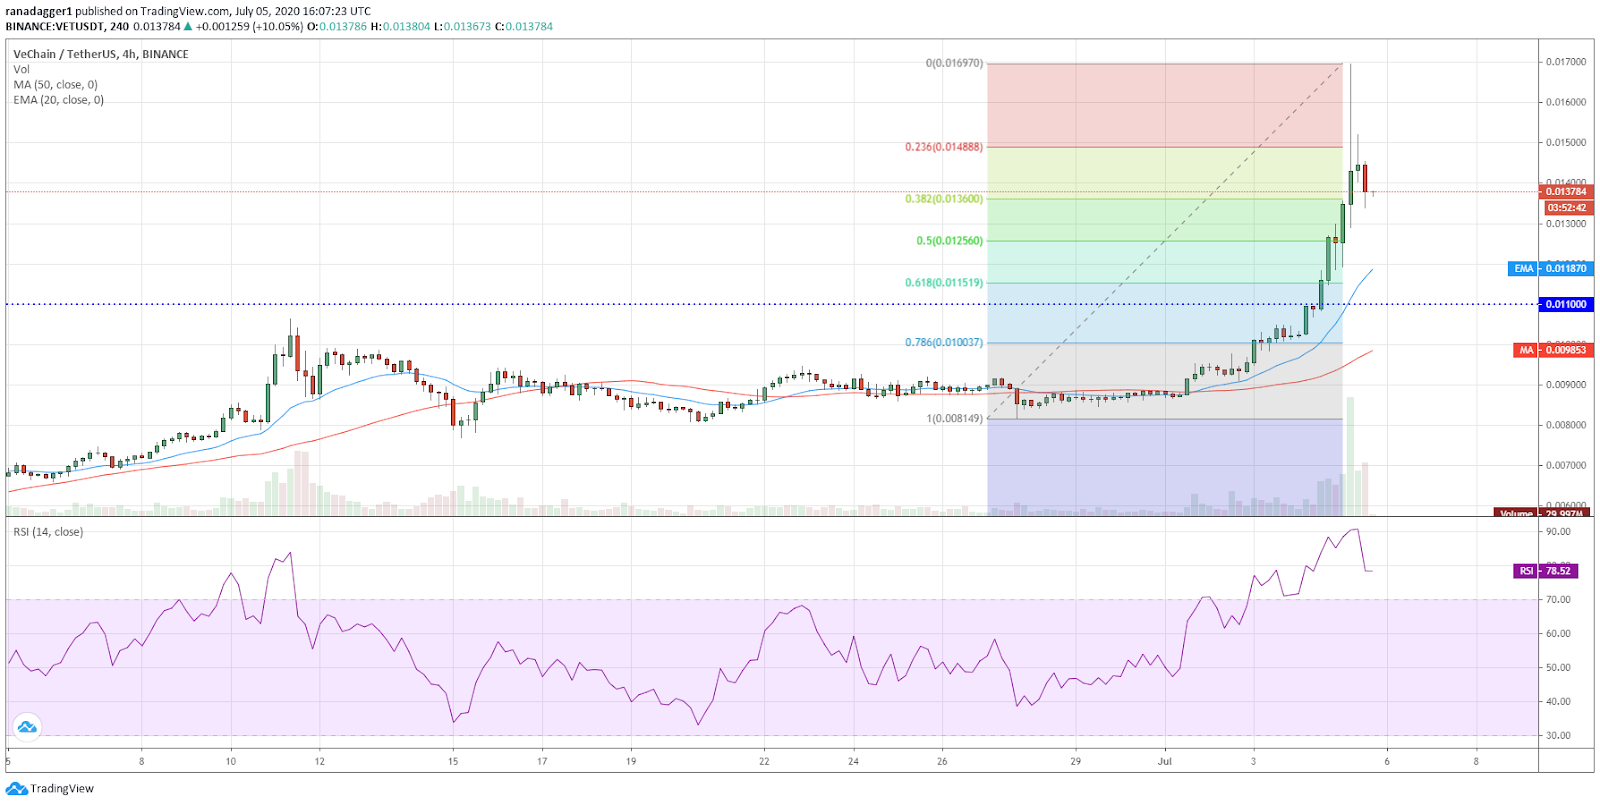
The recent leg of the up move had pushed the RSI deep into the overbought territory, which indicated that the VET/USD pair had become overheated in the short-term.
Currently, the pair is in a pullback, which is likely to extend to the 20-EMA. A bounce off this support could resume the uptrend and this could offer an opportunity to ride the possible move higher.
Instead of chasing the price higher, it is a better strategy to wait for a pullback as that reduces the risk.
The views and opinions expressed here are solely those of the author and do not necessarily reflect the views of Cryptox. Every investment and trading move involves risk, you should conduct your own research when making a decision.


