

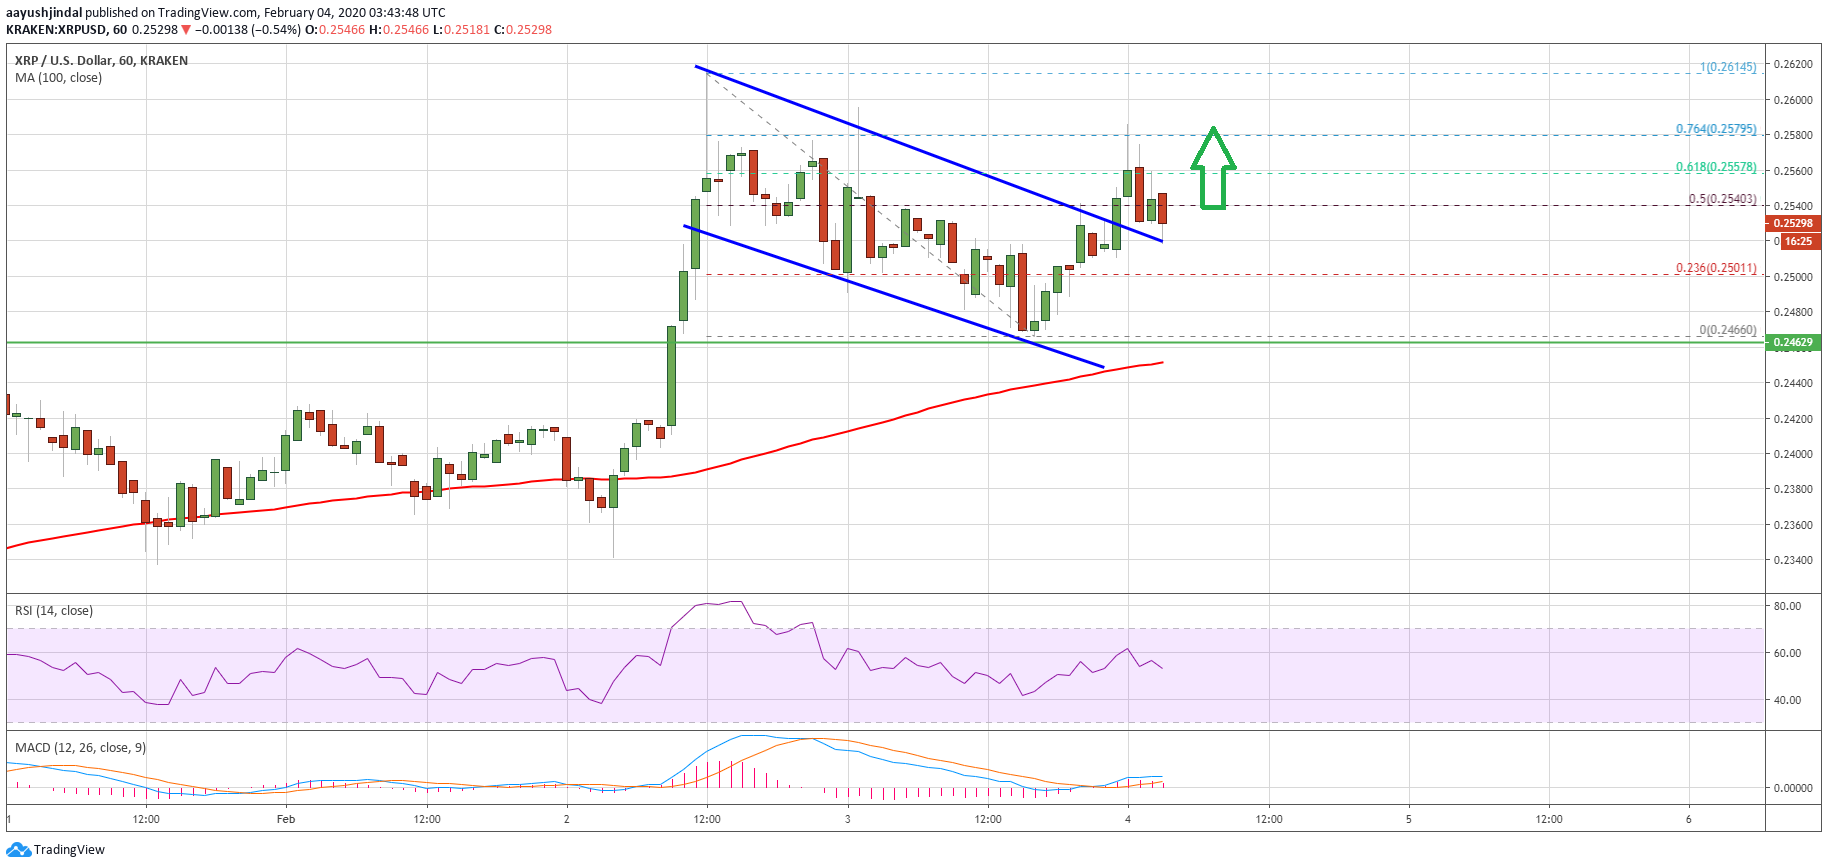
Ripple found support near the $0.2460 area and climbed higher against the US Dollar. XRP price surpassed the key $0.2500 resistance to open the doors for more upsides.
- Ripple price is showing positive signs above $0.2500 and $0.2520 against the US dollar.
- The price bounced back nicely after testing an important support area near $0.2450-$0.2460.
- There was a break above a major bullish flag pattern with resistance near $0.2525 on the hourly chart of the XRP/USD pair (data source from Kraken).
- The pair is likely to continue higher and it could even trade to a new 2020 high above $0.2650.
Ripple Price Signaling Upside Continuation
Recently, ripple traded above the $0.2550 and $0.2600 resistance levels. XRP price even formed a new 2020 high at $0.2614 before correcting lower. It declined below $0.2550 and $0.2500 levels.
However, the $0.2450-$0.2460 area acted as a strong support and the price remained stable above the 100 hourly simple moving average. A low was formed near $0.2466 and recently there was a fresh increase.
It broke the $0.2500 resistance area, plus the 50% Fib retracement level of the recent decline from the $0.2614 high to $0.2466 low. More importantly, there was a break above a major bullish flag pattern with resistance near $0.2525 on the hourly chart of the XRP/USD pair.
Ripple tested the 76.4% Fib retracement level of the recent decline from the $0.2614 high to $0.2466 low. It is currently trading near the same broken flag resistance area at $0.2520, which is acting as a support.
On the upside, an initial resistance is near the $0.2550 level. If the bulls gain strength above $0.2550, there are high chances of a decent upward move towards the $0.2600 area. Any further gains may perhaps lead the price to a new 2020 high above $0.2620.
Key Buy Zones
If ripple bulls fail to keep the price above the $0.2500 level, there is a risk of a downside extension. An initial support is near the $0.2460 area.
The main support is near the $0.2450 level and the 100 hourly simple moving average. If the price fails to stay above the 100 hourly SMA, the bears are likely to take control and the price might drop below the $0.2400 support in the near term.
Technical Indicators
Hourly MACD – The MACD for XRP/USD is about to move into the bearish zone.
Hourly RSI (Relative Strength Index) – The RSI for XRP/USD is currently declining and about to test the 50 level.
Major Support Levels – $0.2460, $0.2450 and $0.2400.
Major Resistance Levels – $0.2550, $0.2580 and $0.2620.


