Bitcoin price rebounded hard from $10,000 and in a flash already found itself back above $11,000. Thus far, the key level couldn’t hold, and now signs are appearing that could suggest the rally was noting more than a bull trap and retest of resistance turned support.
TD Sequential Indicator Gives Bull Trap Warning With Perfected TD 9 Sell Setup
This week, Bitcoin blasted back above $11,000 but failed to hold the critical zone as it did the last time the cryptocurrency had a stretch of extended intraday upside.
At the top of the recent rise, however, the TD Sequential indicator has perfected a TD 9 sell setup. A 9 setup is perfected when the 9 candle reaches higher than its previous candle closes – imperfect setups are less reliable, but can still result in a drop.
Related Reading | Bitcoin Price Revisiting $11,000 Could Confirm Short-Term Bearish Reversal Pattern
The tool was designed by market timing expert Thomas Demark to signal trend exhaustion, and therefore, potential turning points that could lead to reversals.
The signal appearing at the height of a retest of support turned resistance, could suggest that the latest rally is a bull trap and more downside is next for the cryptocurrency.
BTCUSD Daily TD 9 Sell Signal TD Sequential Indicator | Source: TradingView
Bearish Retest And Possible Head And Shoulders Pullback Confirms Support As Resistance
TD 9 signals are usually accurate enough to compel traders to take a position in any asset. The tool has called several tops and bottoms in Bitcoin – and recently triggered the same sell setup on the two-week timeframe at the peak 2020 high.
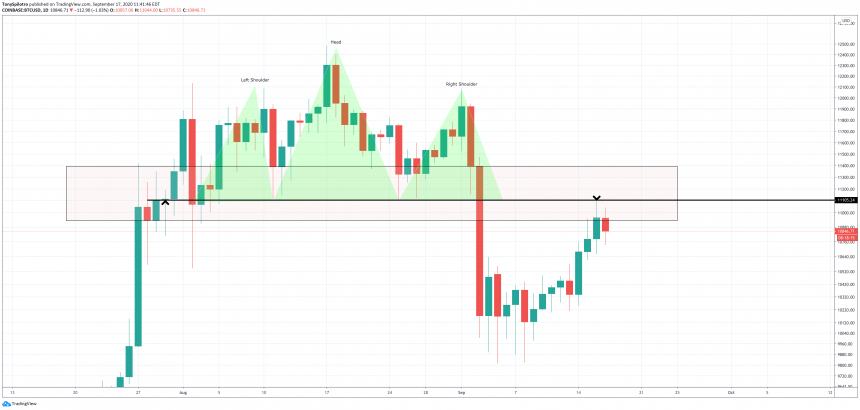
If the bull trap confirms and prices fall, what may have actually happened was a pullback to retest support turned resistance at the neckline of a head and shoulders top formation.
BTCUSD Daily Head and Shoulders Pullback Confirmed? | Source: TradingView
Head and shoulder are typically reversal patterns. But before prices reach their target, statistics show that price actin tends to come back to retest the neckline in a throwback.
Once confirmed, the target is then reached. This pullback and bearish retest coinciding with a highly accurate sell signal doesn’t bode well for Bitcoin bulls, who may have been over confident that $10,000 had held thus far.
Related Reading | Did Bitcoin Just Confirm It’s Largest Reversal Pattern In History?
Another retest of $10,000 could be next after failing to hold above $11,000. Was this latest move a bull trap, or are bears in for a surprise in the days ahead when the current rally continues higher?
Featured image from DepositPhotos, Charts from TradingView


 BTCUSD Daily Head and Shoulders Pullback Confirmed? | Source:

