

Bitcoin’s intense rally throughout the past couple of days has allowed it to fly past multiple crucial resistance levels.
Bulls are now attempting to form the $11,000 price level into a strong base of support, but the selling pressure here appears to be ramping up.
One positive technical development seen overnight was the potent reaction to the $10,500 level.
This previously crucial macro resistance level has now been confirmed as a strong support level, as BTC dipped here overnight before seeing an instant influx of buying pressure that sent it up to over $11,000.
Now, one economist who focuses primarily on cryptocurrency is noting that Bitcoin is not showing any explicit signs that it has formed a macro top.
He points to the asset’s basis on BitMEX, which typically hits over 20% when the crypto enters overbought territory. At the moment, it is currently sitting at 12%.
He concludes that this means further upside could be imminent.
Bitcoin Flashes Signs of Strength Following $10,500 Retest
At the time of writing, Bitcoin is trading down marginally at its current price of $11,000. This is where it has been consolidating at in the time following its intense upswing.
Bulls were able to propel the cryptocurrency as high as $11,400 overnight, but the selling pressure it found here was quite significant.
It now appears that the mid-to-upper $11,000 region is a resistance level that won’t be surmounted unless bulls can garner greater support.
One positive sign to consider in the near-term is Bitcoin’s ability to confirm its previous resistance at $10,500 as a strong support level.
Bears tested this level overnight after they catalyzed a sharp selloff. Once this price level was touched by BTC, the digital asset instantly rebounded back up to $11,000.
This is a textbook support-resistance flip, which is a historically bullish sign that seems to indicate further upside could be right around the corner.
This Metric Signals BTC Hasn’t Yet Formed a Local High
The resistance within the mid-$11,000 region is quite intense, and it may take some time before bulls can shatter it.
Nonetheless, one crypto-focused economist explained in a recent post that an indicator of BTC tops is the 3-month basis on BitMEX and other platforms
Historically, BTC appears to top out when the basis hits over roughly 23%. This happened during the June 2019 top and the February 2020 top.
The economist notes that Bitcoin’s current basis sits at 12% – suggesting it has quite a way to rally before its uptrend losses steam.
“Spotting Major Bitcoin Tops: The June 2019 and February 2020 tops happened when the 3 month basis hit >23% on Bitmex & >24% on Deribit. On Jun/26 and Feb/13. This only happened one other time, Jun/23/2019, also right before a major correction. Bitmex’s 3 month basis is now 12%.”
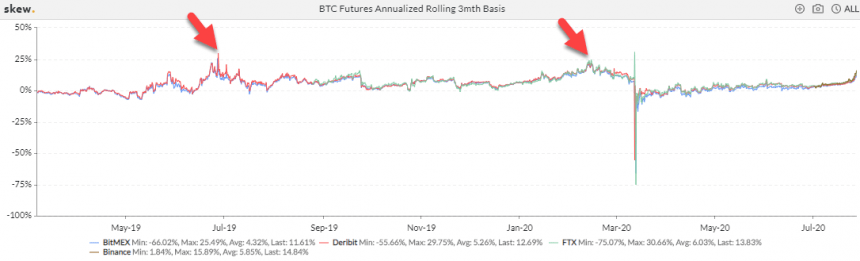
Image Courtesy of Alex Krüger. Data via Skew.
This factor, coupled with Bitcoin’s support at $10,500, does seem to bode well for bulls.
Featured image from Shutterstock.
Pricing data via TradingView.
 Market Cap Could Surpass $3T by Mid-2025 Fueled by Geopolitical Instability")

