

The bitcoin price rejected $9,500, a multi-year resistance it has been teasing with throughout the past two weeks. The last time it rejected at this level in a similar pattern, it dropped to the $6,000s.
Current fractal akin to 2018 price trend of bitcoin
In the first half of 2018, the bitcoin price struggled to recover following its correction from $11,500. It stayed within a range in between $6,500 and $9,500 for seven months, rejecting every attempt to break out of the $9,500 resistance level.
Bitcoin price trend in February 2020 eerily showing similarities as 2018
If the current price trend of bitcoin plays similarly as the 2018 fractal, it is likely to reject at $9,500 and result in the resumption of the bearish trend.
For that to happen, the weekly candle for February 3 to 9 would have to act as an evening star candle, and sell-off in the second week of February.
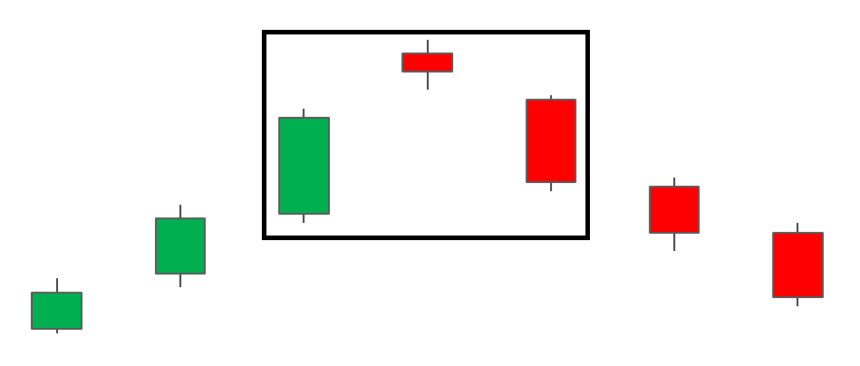
Conventional evening star pattern in technical analysis, which indicates a short-term top (source: DailyFX)
As explained by prominent technical analysts like Cred, bitcoin is now in an indecisive zone wherein it is not clear whether it is ready to break out of the $9,500 resistance level or break below key support levels.
A break above $9,500 would mean a retest of the $10,500 weekly high the bitcoin price hit in October 2019. Contrary to that, a hard rejection at $9,500 would result in the retest of $8,700 and possibly lower range levels including $7,700.
This scenario would require the current weekly candle to close as an evening star and maintain a bearish formation. As such, while possible, it is not a definitive confirmation of downtrend.
Technicals to consider
The total open interest on BitMEX, which refers to the sum of all long and short contracts open on the margin trading platform surpassed $1 billion.
Typically, when OI reaches the $1 billion threshold, it leads to an explosive price movement as it pushes traders to readjust their positions.
With a high rate of funding on BitMEX combined with the tendency of bitcoin to pullback at $1 billion OI, some technical analysts have hinted at the possibility of a steep pullback in the short-term.
Top trader Peter Brandt also suggested that in lower time frames, the bitcoin price is showing a head and shoulders pattern. It usually indicates a short-term top as a consequence of failing to breach range levels.
A popular brand of shampoo pic.twitter.com/dSnFFssirD
— Peter Brandt (@PeterLBrandt) February 2, 2020
The block reward halving is three months away, set to occur in early May, potentially in late April. But, considering that $9,500 is a multi-year resistance, many traders have become cautious at the current level.
The general sentiment among traders is that it is not a favorable level to long and not a strong enough rejection to short.
CME opened. pic.twitter.com/1lsZE8zpgz
— Hsaka (@HsakaTrades) February 2, 2020
There are several CME gaps below the $9,000 level as said by cryptocurrency trader Hsaka, which could also be a factor for a minor pullback.


