Lately, Bitcoin (BTC) price has been trading in a range that favors bears and this has led traders to shift their focus to altcoins.
Interestingly, there has also been some very volatile price action taking place over the past 24-hours, especially with Binance Initial Exchange Offerings (IEOs) like Matic Network (MATIC) which dropped 60% on Dec. 9. This drop led several other Binance IEO’s to dump and a handful of non-IEO altcoins also followed.
However, one of the most active coins lately is Tezos (XTZ), and its recent 100% rally validates the need for a deeper analysis of the asset’s price action.
Crypto market daily performance. Source: Coin360
Tezos rallies 100% over the past six weeks
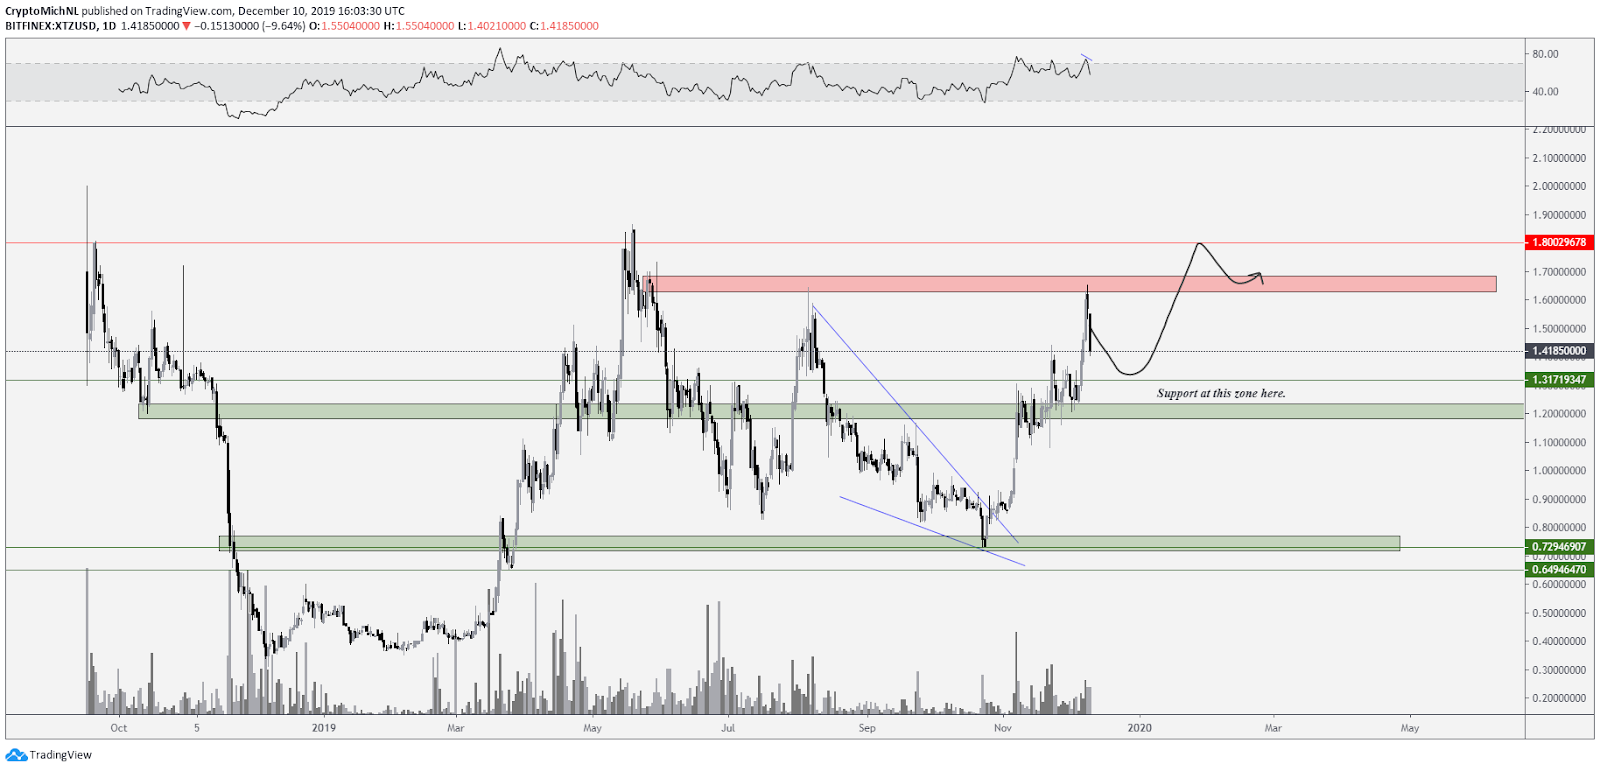
Tezos was one of the most energetic performers throughout November and the price rallied from $0.735 to a high of $1.64 a few days ago.
XTZ USD daily chart. Source: TradingView
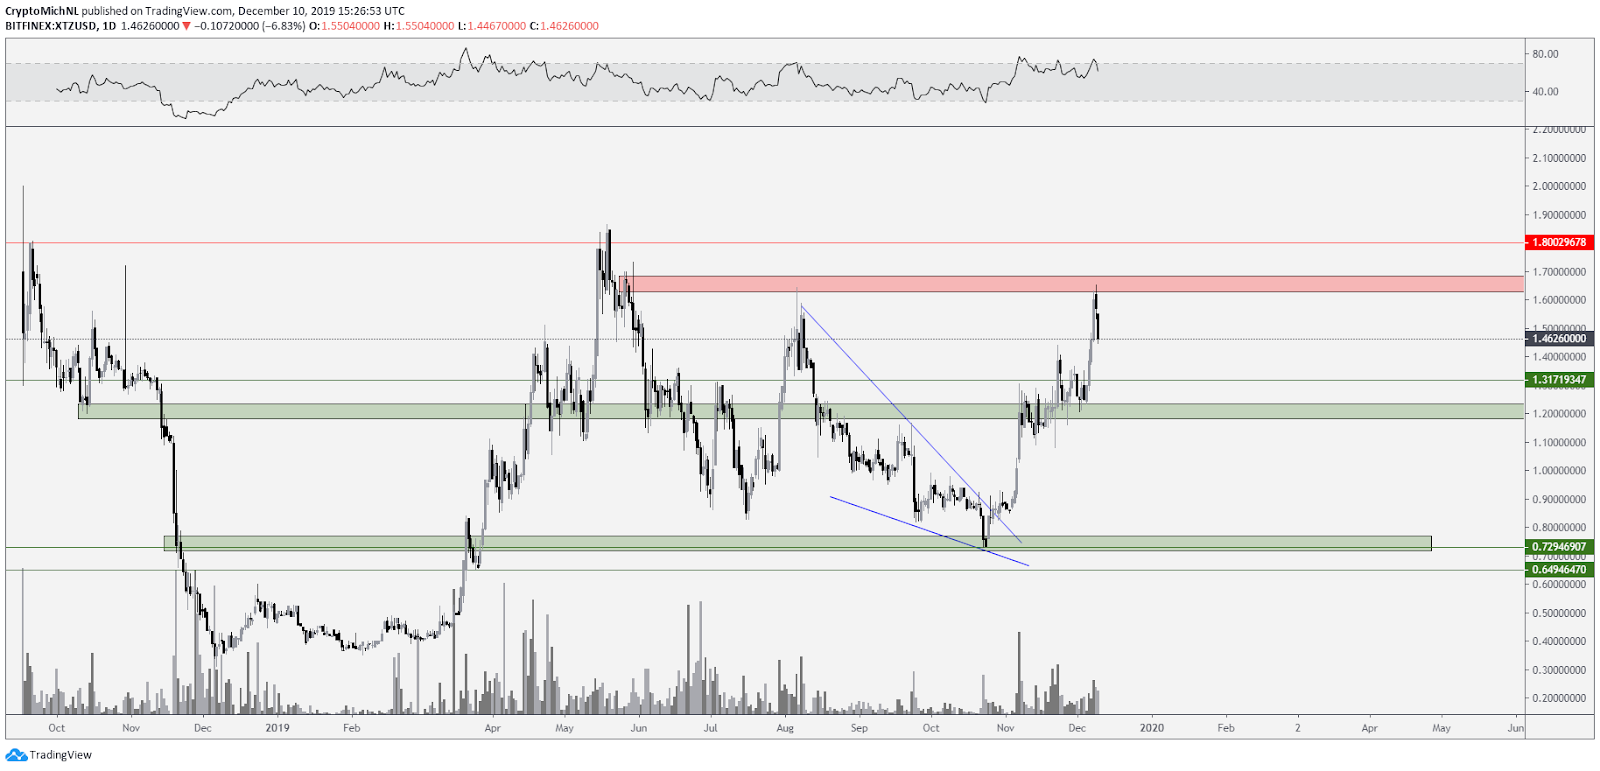
The daily timeframe of the XTZ/USD pair shows a nice breakout from a falling wedge pattern that occurred at the end of October. The price immediately flipped the $0.85 level as support, which created space for continued upwards movements towards $1.65. The current level is the resistance level where the price was rejected.
This rejection also shows that the chart has potential bearish divergences, which can imply that the price is temporarily reversing here. Exciting levels for support are seen through the $1.20 area and the $1.30 horizontal level.
Bearish divergences spotted on the 4-hour chart
XTZ USD 4-hour chart. Source: TradingView
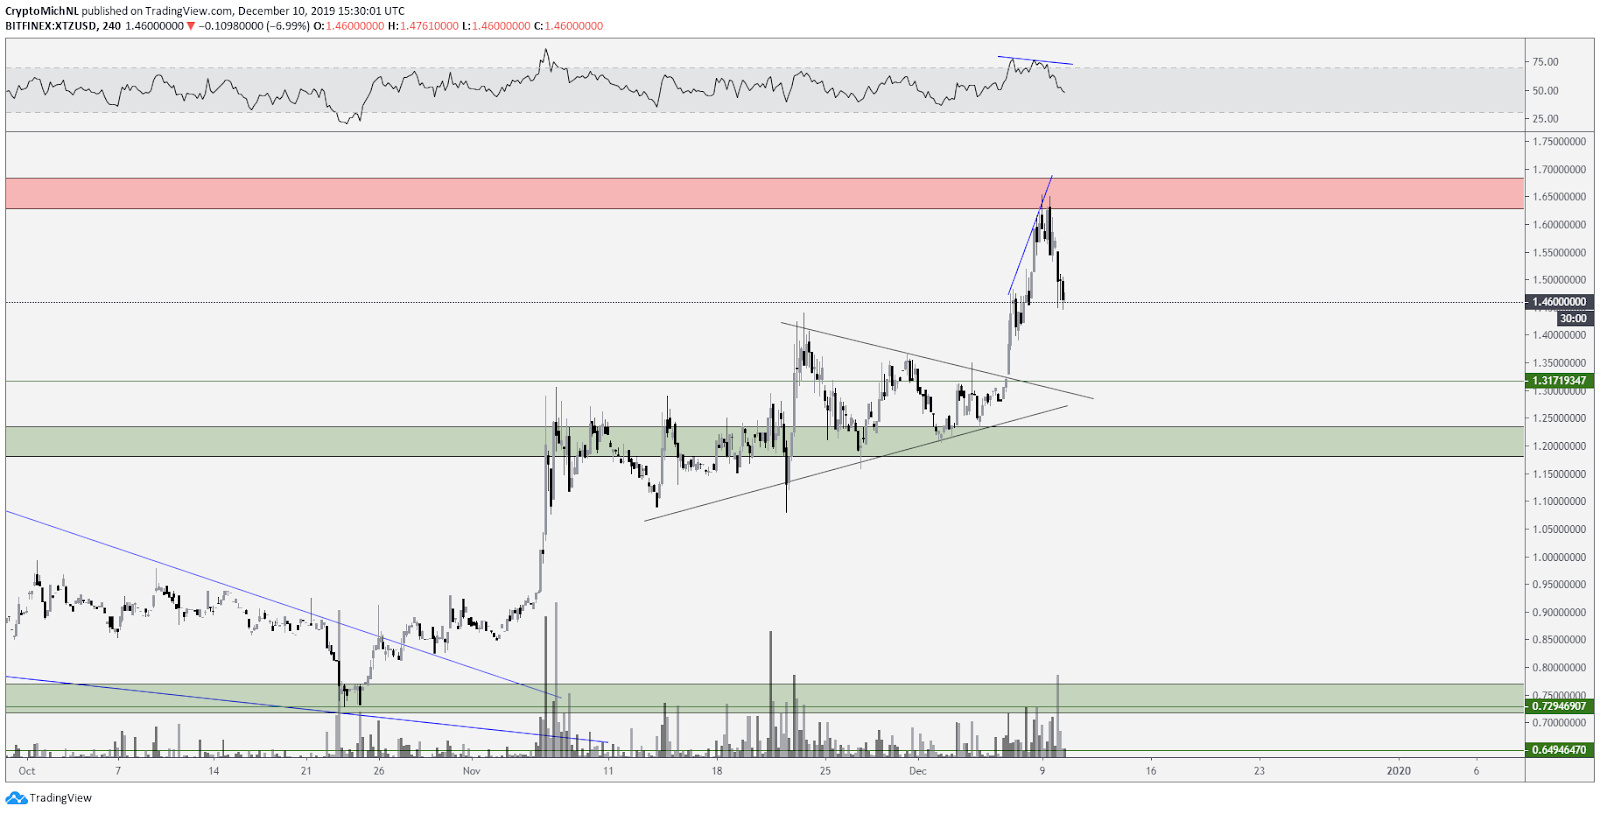
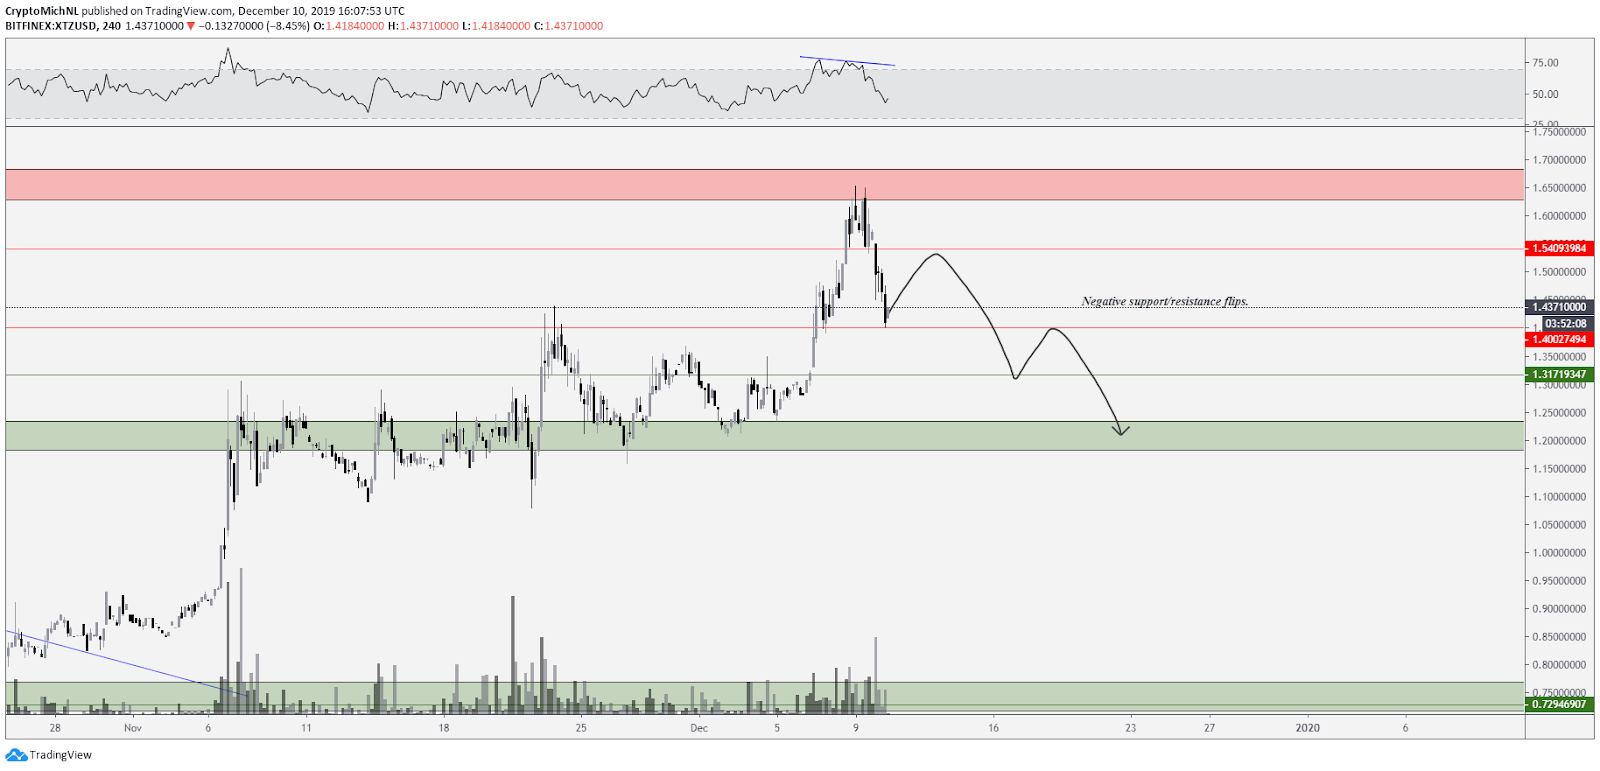
The 4-hour chart of Tezos is showing a continuation pattern at $1.30. The price continued to make higher lows, which usually marks an uptrend and broke out of the triangle structure at the beginning of December.
This breakout caused the price to push towards the next resistance zone, the red area around $1.65. As is seen in the chart, the RSI indicator started to show a bearish divergence, which generally marks a potential trend reversal. In this case, the price started to reverse and dropped towards the $1.46 level.
XTZ/BTC pair shows a possible top formation
XTZ BTC daily chart. Source: TradingView
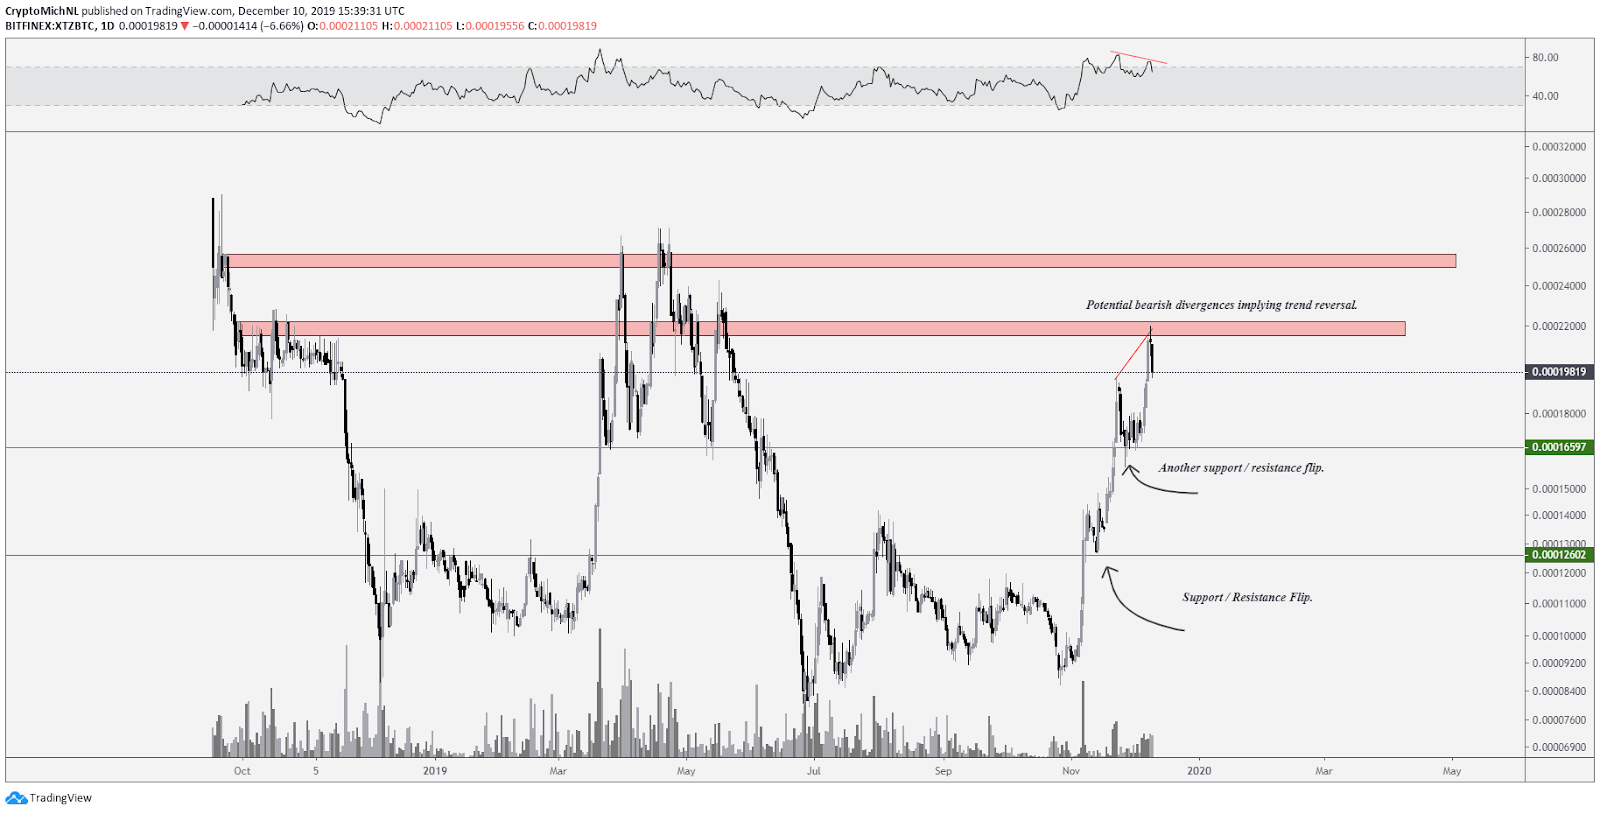
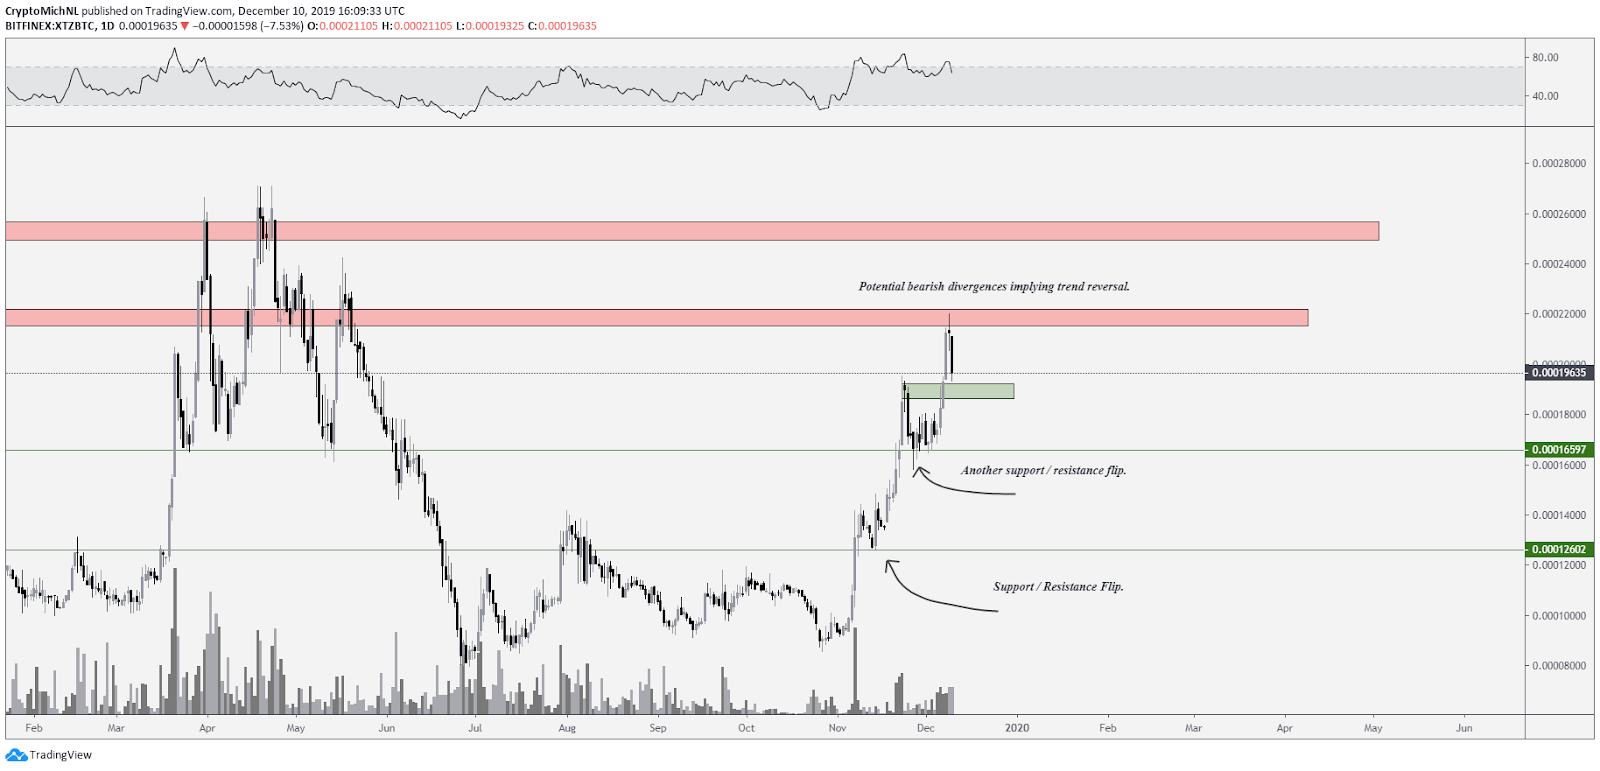
The XTZ/BTC pair is showing a healthy chart in which many technical aspects are shown. First of all, the price pushed through the resistance at 0.0012600 satoshis (sats) at the beginning of November. This area was immediately flipped support.
These well-known support/resistance flips are the way to go in trading as they generally lead to the continuation of the price movements. It also grants an excellent trade opportunity with low risks involved.
Similarly, the movements at 0.0016500 (sats) are identical to the ones seen at 0.0012600 (sats) and also shows a support/resistance flip at this level. This caused the price to move to the next horizontal level, seen around 0.0022000 (sats).
However, as was discussed earlier, divergences often lead to the top or bottom signals. Traders should note that Tezos is showing a bearish divergence on the daily timeframe.
Given that the divergence is on such a high timeframe, the significance and strength are high (as these divergences are stronger than on a 4-hour chart, for example). Therefore, traders should take note of this and be cautious.
Multiple supports identified on the 4-hour chart
XTZ BTC 4-hour chart. Source: TradingView
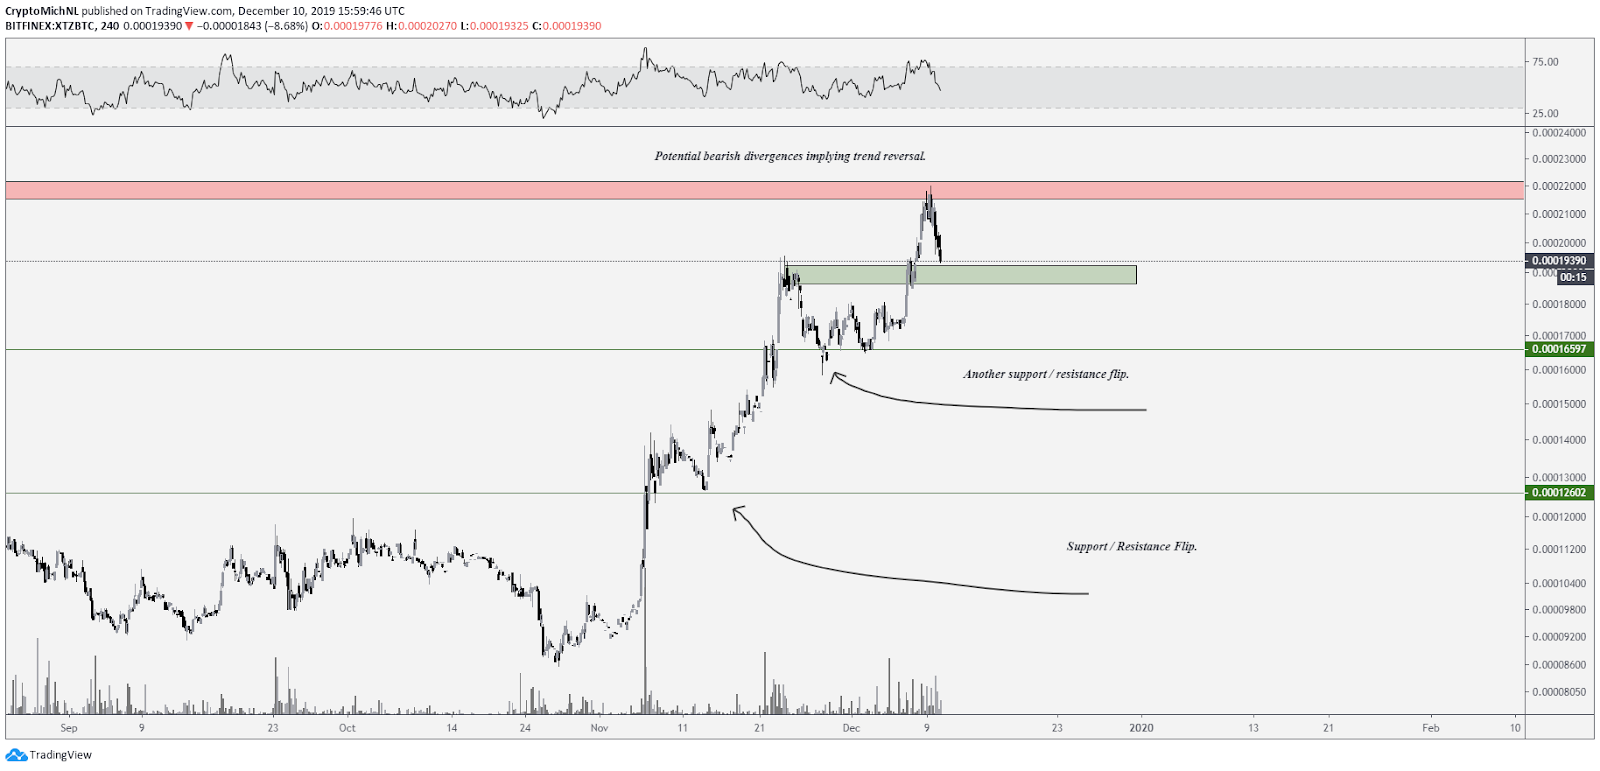
The 4-hour chart is showing the same ‘support/resistance flips’ as we’ve seen in the daily timeframe and this is showing a strong upward trend. However, the price reversed from the red resistance zone around 0.0022000 (sats) and is searching for short term support at the time of writing.
One of the first areas is the green zone where a potential bounce could be justified. It is extremely important and if the green zone holds, Tezos could move to a new higher high in which a continuation of the uptrend is likely.
If no support is found and a higher high avoided, then continuation to the downside is likely with potential targets of 0.0016500 (sats) as the first level.
Bullish scenario
XTZ USD bullish scenario. Source: TradingView
Tezos price needs to stabilize through finding support. The first main source of support can be found through the $1.20 – $1.30 area. If the price makes another support/resistance flip here, then Tezos is likely to see another test of the upper resistance zones around $1.65 and $1.80.
The $1.20-$1.30 would be a beneficial level for traders to look for potential long entries, similar to a possible flip of the $1.65-$1.80 level as that would lead to price discovery and continuous movement on the upside.
Bearish scenario
XTZ USD bearish scenario. Source: TradingView
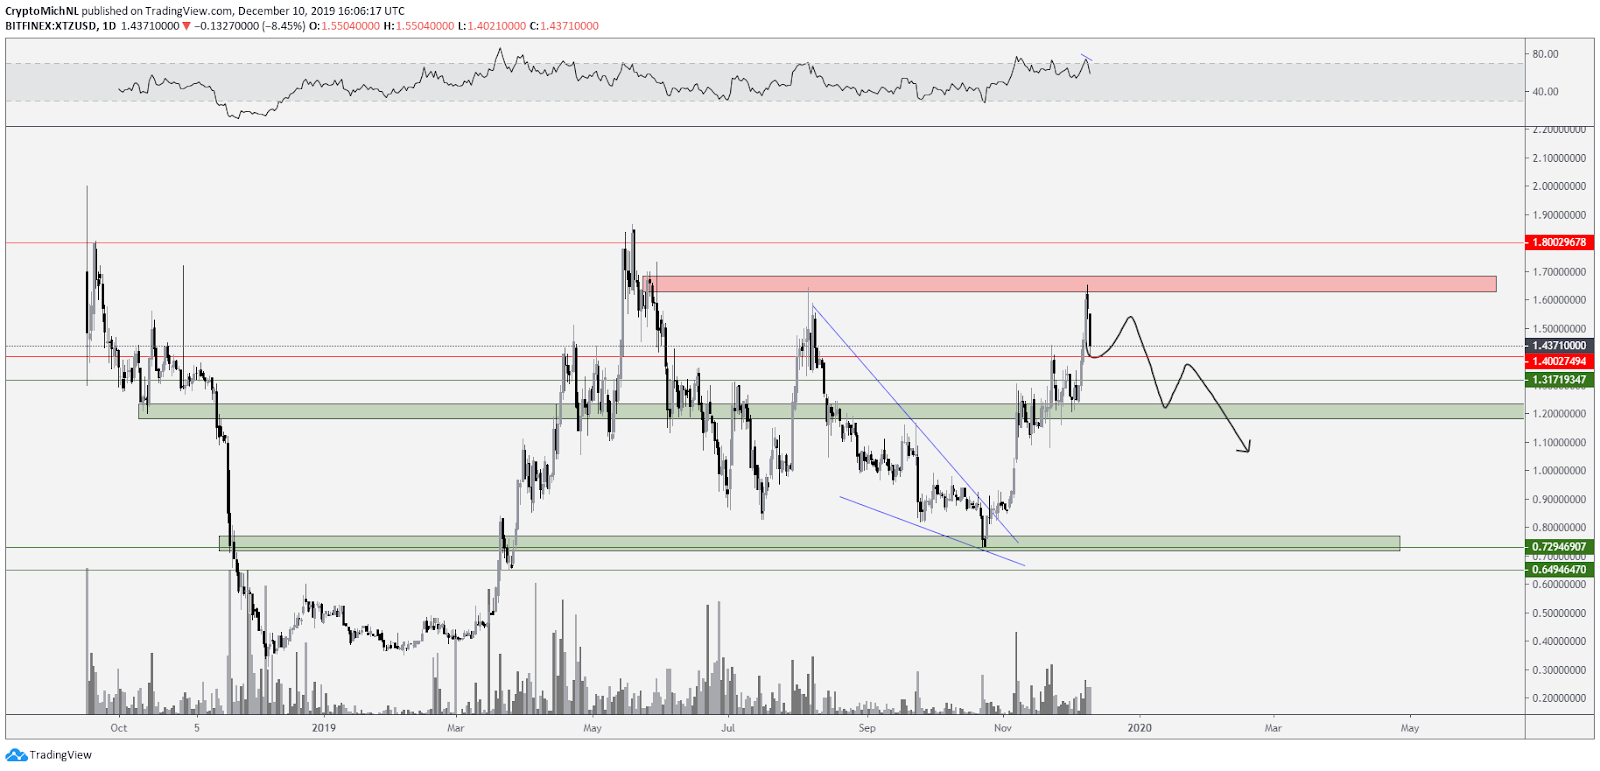
The bearish scenarios are seen through different perspectives. The first scenario describes a potential bounce from this $1.40 to $1.55 area, which marks a lower high. After this lower high, the support/resistance flips start to occur to the downside, which would lead to $1.40 and $1.20 to be flipped resistance.
XTZ USD 4-hour chart bearish scenario. Source: TradingView
Given that the chart shows a bearish divergence, it’s not unlikely to expect further downwards tests before the price is ready to make another attack on the resistance area.
In that regard, the area to look for the lower high is the $1.55 area. If Tezos fails to break out of this zone, it is likely that $1.30 and $1.20 will function as support.
XTZ/BTC pair must hold
XTZ BTC daily chart. Source: TradingView
The basic level for XTZ/BTC to hold is the green area highlighted on the daily chart above. Holding here would grant another support/resistance flip and also justify another opportunity to push to the resistances (as discussed in the bullish scenario on the USD pair as well).
If this area fails to provide support, it’s likely that Tezos will retest the 0.0016500 (sats) area before the price is ready to make any short term reversal.
The views and opinions expressed here are solely those of the author and do not necessarily reflect the views of CryptoX. Every investment and trading move involves risk. You should conduct your own research when making a decision.

