

Solana (SOL) struggles to break key resistance after it suffers a huge loss on a hot wallet hack, losing over $5M creating so much panic in the heart of many faithful.
The price of SOL looked strong in the early part of the week, trading above $40, trying to break the resistance before having an attack on some wallets drained more than $8 million from Solana users. It now struggles to break above the 50 exponential moving average (EMA) on the one-hour (1H) chart.
SOL Daily Chart Analysis
The daily chart for SOL shows it is trading at $38.7 below the 50 & 200 exponential moving average after a reject from reclaiming this region early this week.
This means SOL will need to break above this resistance claimed earlier; this has been a region SOL has struggled to reclaim on the daily chart.
The volume of SOL indicates there are no buy activities due to the recent incident that has affected the price of SOL.
For SOL to trade higher in price, it needs to break this daily resistance of $40.9; else, we could see some pullbacks to the region of $36.6 if bulls do not step in.
The region of $36.6 is a strong demand zone where more buyers in recent times have seen SOL in a good position to accumulate.
Major resistance on the daily chart – $40.9.
Major support on the daily chart – $36.6, $32.
SOL Price Analysis On The 4H Chart
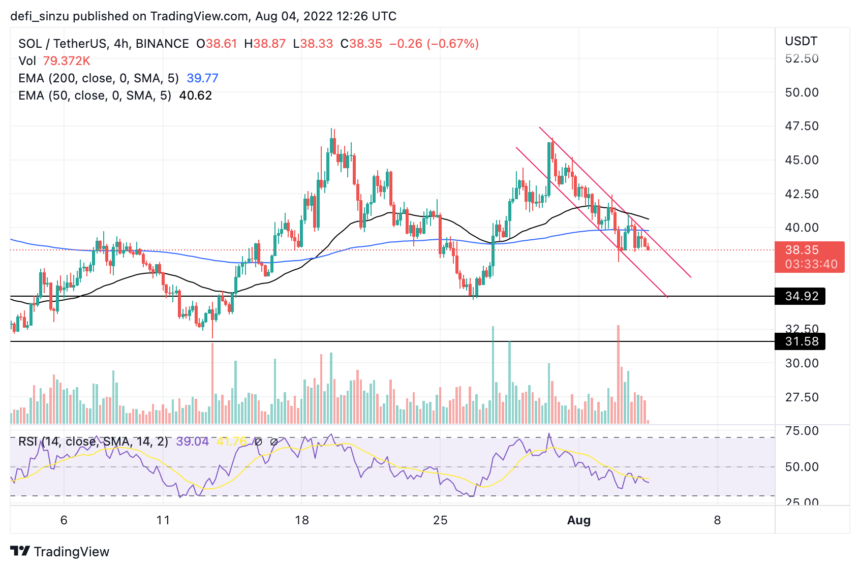
The price of SOL on the 4H chart shows the price is on a downtrend with swing lows respecting the trendline acting as resistance.
SOL needs to break to the upside of this channel for a change in trend.
SOL is trading below the 50 & 200 EMA, indicating a downtrend direction for the period until a reclaim of the resistance level above the $40 mark before a trend shift can occur.
If SOL fails to reclaim and break above the resistance of $40, it would likely revisit the 4H support region of $35 and $32.
The volume on the SOL chart indicates more sell pressure compared to buys, and if bulls are unwilling to step in, then support areas would be ideal for SOL to build more buy bids.
The relative strength Index (RSI) for SOL is below the 40 mark, indicating more sales than buys for now.
Resistance on the 4H chart – $40.9.
Support on the 4H chart – $35, $32.
SOL 1H Chart Analysis
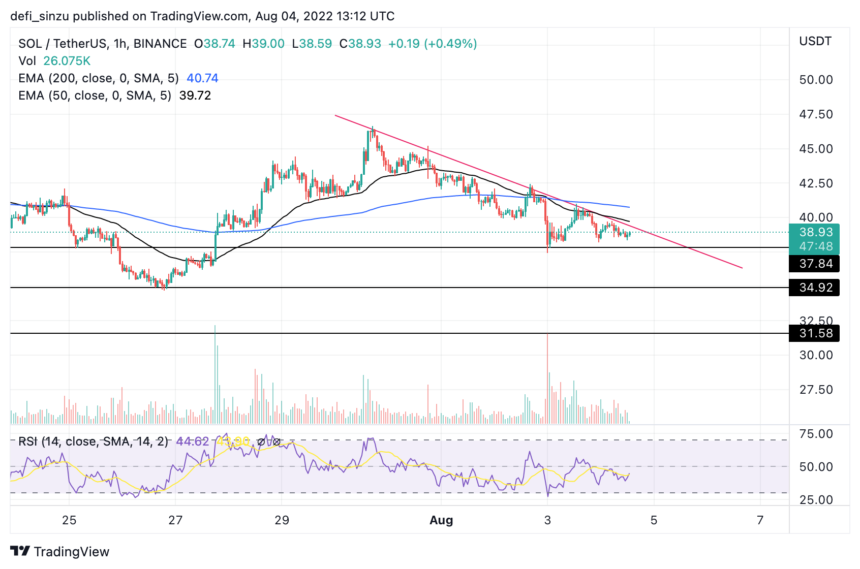
The price of SOL on the one hourly timeframe is in an asymmetric triangle indicating a crucial time for SOL price. There would be a breakout from this region to the chart’s upside or downside.
A breakout to the upside, SOL will need to overcome the resistance at the $39.7 and $40.9 region for more upside.
A breakout to the downside, SOL will need to hold the supports at the region of $37.7 and $35; else, we could visit more regions with a high demand of $32
Resistance on the 1H chart – $39.7, $40.9.
Support on the 1H chart – $37.7, $35.
Featured image from Analytics Insight, Charts from TradingView.com


