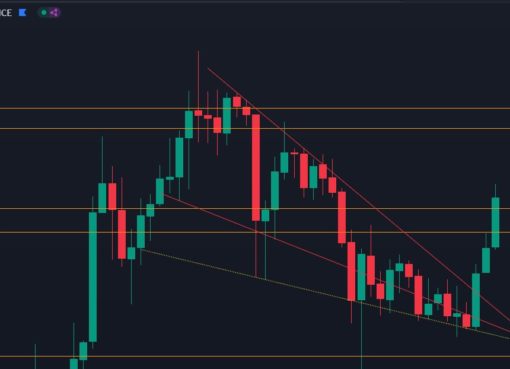
Solana (SOL) recovered from the slight pullback yesterday, even when the general crypto market cap dropped today. SOL which has been on an uptrend in the past week saw a 28.44% increase during this time. This increase might be due to combined economic factors and Solana’s growing utility among crypto users.
What Is Driving The Price Of Solana?
The Solana network is enjoying more attention from the increased crypto awareness and adoption among individual and institutional investors. The network has rolled out plans for 2023, creating excitement among its online community.
Related Reading: XRP Vs. Cardano (ADA), Which Is The Better Investment In 2023?
The SOL network provides developers access and a framework to build DApps on its blockchain. For instance, Phantom, a crypto wallet, is hosted on the Solana blockchain. The wallet supports decentralized finance, staking, and NFT transactions for Solana users.
Also, SolanaMobile, on Twitter, announced its intention to launch Solana Mobile Stack and Saga phones. The mobile phone will bring the Solana blockchain to the fingertips of users. Users are keen on the launch of the device, slated for this early this year.
Additionally, as an altcoin, Solana correlates to bitcoin in price action. So, Bitcoin’s recent rally and other economic factors might be influencing SOL’s price.
The macroeconomic factors affecting SOL price include a low Consumer Price Index (CPI) value for December 2022. The CPI notes the overall change in consumer prices in a specific timeframe. These factors combined could be responsible for SOL’s price surge in the past few weeks.
Solana Price Prediction: Will SOL Break Its Resistance?
SOL is recovering from yesterday’s slight pullback, trading at $21.28. The support levels are $19.60, $20.09, and $20.75, while the resistance levels are $21.90, $22.40, and $23.05. SOL is trading below its 50-day Simple Moving Average (SMA) and 200-day SMA on the weekly charts. These signs point to a bearish trend or slight reversal in the price of SOL ahead.
Related Reading: HNT Balloons As Token Gets 36% More Helium In Run-Up To Network Migration
The Relative Strength Index (RSI) is close to the oversold region at 43.04 and might continue to descend if the bears sustain their charge.
The Moving Average Convergence/Divergence (MACD) is below its signal line and giving off negative values, indicating a bearish reversal despite the rally.
The price of SOL might dip further and touch the $19.69 support. The next rally will likely surpass the first resistance level of $21.90 in the coming days.
At press time, the price of SOL was trading at $21.42. Its trading volume is down over 50% in the last 24 hours to be sitting at $638.8 million.
Featured image from Pixabay and chart from TradingView.com


