

Solana rallied above the $100 and $110 levels. SOL price is now correcting gains, but the bulls might remain active near the $100 level.
- SOL price started a fresh rally above the $100 resistance against the US Dollar.
- The price is now trading above $100 and the 100 simple moving average (4 hours).
- There is a key bullish trend line forming with support near $102 on the 4-hour chart of the SOL/USD pair (data source from Kraken).
- The pair could start a fresh rally unless there is a close below the $100 support.
Solana Price Remains In Uptrend
In the past few days, Solana saw a major upward move above the $90 and $100 levels, unlike Bitcoin and Ethereum. SOL even rallied above the $120 level.
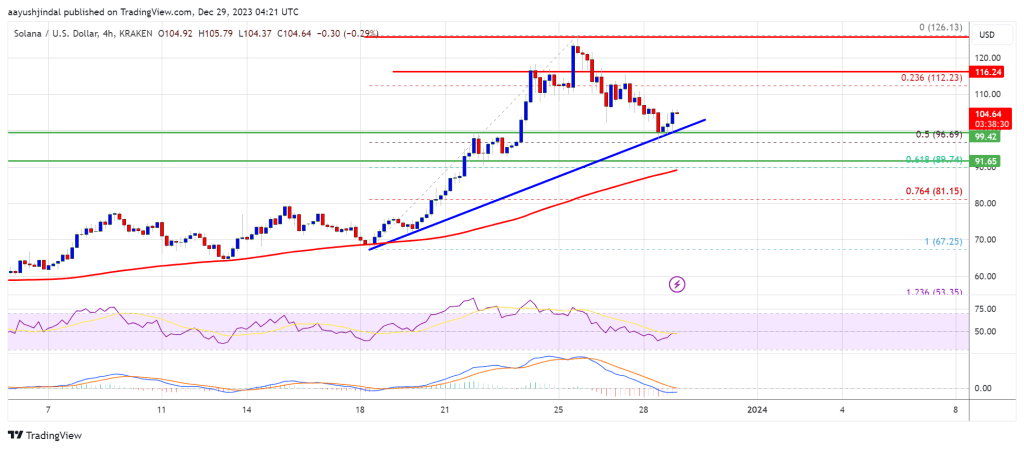
A new multi-week high was formed near $126.13 and the price is now correcting gains. There was a move below the $115 and $112 levels. The price declined below the 23.6% Fib retracement level of the upward move from the $67.25 swing low to the $126.13 high.
SOL is now trading above $100 and the 100 simple moving average (4 hours). There is also a key bullish trend line forming with support near $102 on the 4-hour chart of the SOL/USD pair.
Source: SOLUSD on TradingView.com
On the upside, immediate resistance is near the $112 level. The first major resistance is near the $120 level. The main resistance is now near $125. A successful close above the $125 resistance could set the pace for another major rally. The next key resistance is near $132. Any more gains might send the price toward the $145 level.
More Losses in SOL?
If SOL fails to rally above the $120 resistance, it could continue to move down. Initial support on the downside is near the $100 level.
The first major support is near the $90 level or the 61.8% Fib retracement level of the upward move from the $67.25 swing low to the $126.13 high, below which the price could test $80. If there is a close below the $80 support, the price could decline toward the $68 support in the near term.
Technical Indicators
4-Hours MACD – The MACD for SOL/USD is losing pace in the bullish zone.
4-Hours RSI (Relative Strength Index) – The RSI for SOL/USD is below the 50 level.
Major Support Levels – $100, and $92.
Major Resistance Levels – $115, $120, and $125.
Disclaimer: The article is provided for educational purposes only. It does not represent the opinions of NewsBTC on whether to buy, sell or hold any investments and naturally investing carries risks. You are advised to conduct your own research before making any investment decisions. Use information provided on this website entirely at your own risk.


