Shiba Inu (SHIB) price was at the lowest versus its top rival Dogecoin (DOGE) in November 2022. Three months later, the dynamics have flipped.
SHIB price rises 100% versus DOGE
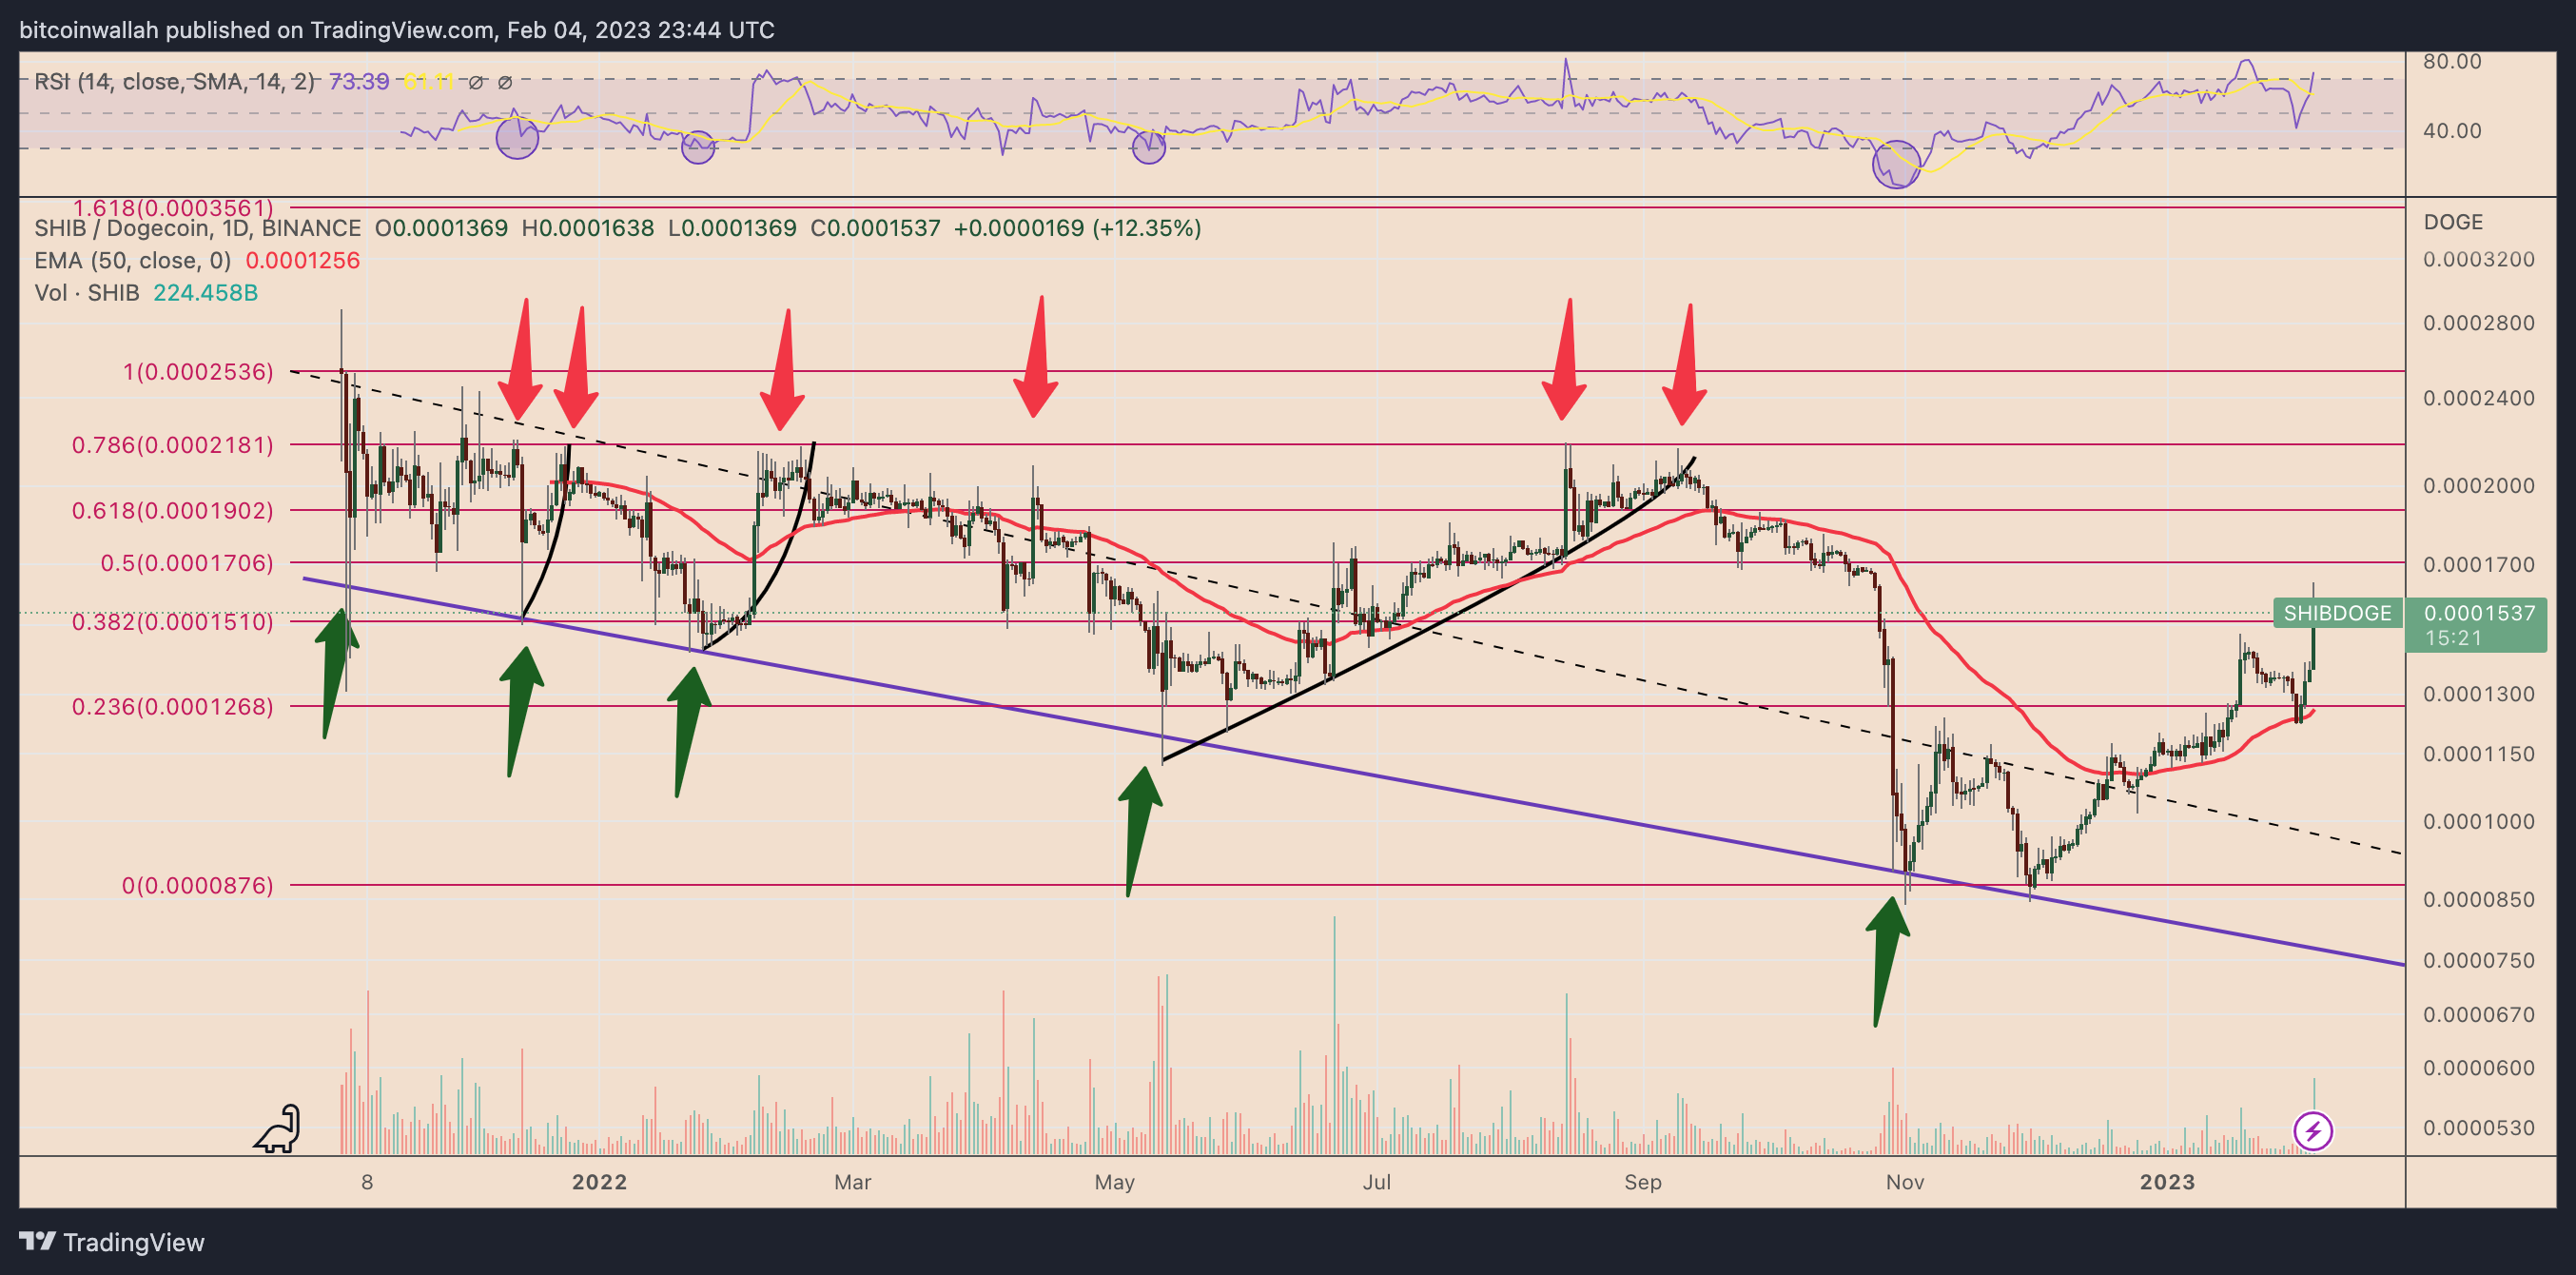
On Feb. 4, 2023, the SHIB/DOGE pair reached 0.00001638 DOGE, up almost 100% three months after bottoming out at 0.00000993 DOGE, its lowest level on record.
The sharp recovery came as investors’ focus shifted to the impending launch of Shibarium, a Shiba Inu-backed layer-2 blockchain built on the Ethereum mainnet, announced on Jan. 16.
As Cryptox reported, the SHIB price rebound gained momentum amid reports that Shibarium will go live on Feb. 14.
In comparison, Dogecoin’s fundamentals looked pale, with Elon Musk suspending a DOGE tipping bot for violating Twitter’s rules.
Hey @elonmusk
Our Tipping bot @MyDogeTip got suspended for no reason. It was a good bot used to spread Dogecoin across the community. pic.twitter.com/4PTa1siOA7
— DogeDesigner (@cb_doge) February 1, 2023
Nonetheless, both memecoins have had a great start to 2023. SHIB/USD is up almost 85% while DOGE/USD is up 36% year-to-date.
What’s next for SHIB/DOGE?
The SHIB/DOGE recovery trend is set to continue in the coming weeks, according to several technical indicators.
Namely, the pair could climb to 0.00002181 by March 2023 based on historic cycles, up around 40% from current price levels, as shown in the chart below.

DOGE, SHIB price downside in February?
But while SHIB appears to be in a better position to outperform DOGE, both memecoins face headwinds against the dollar in February.
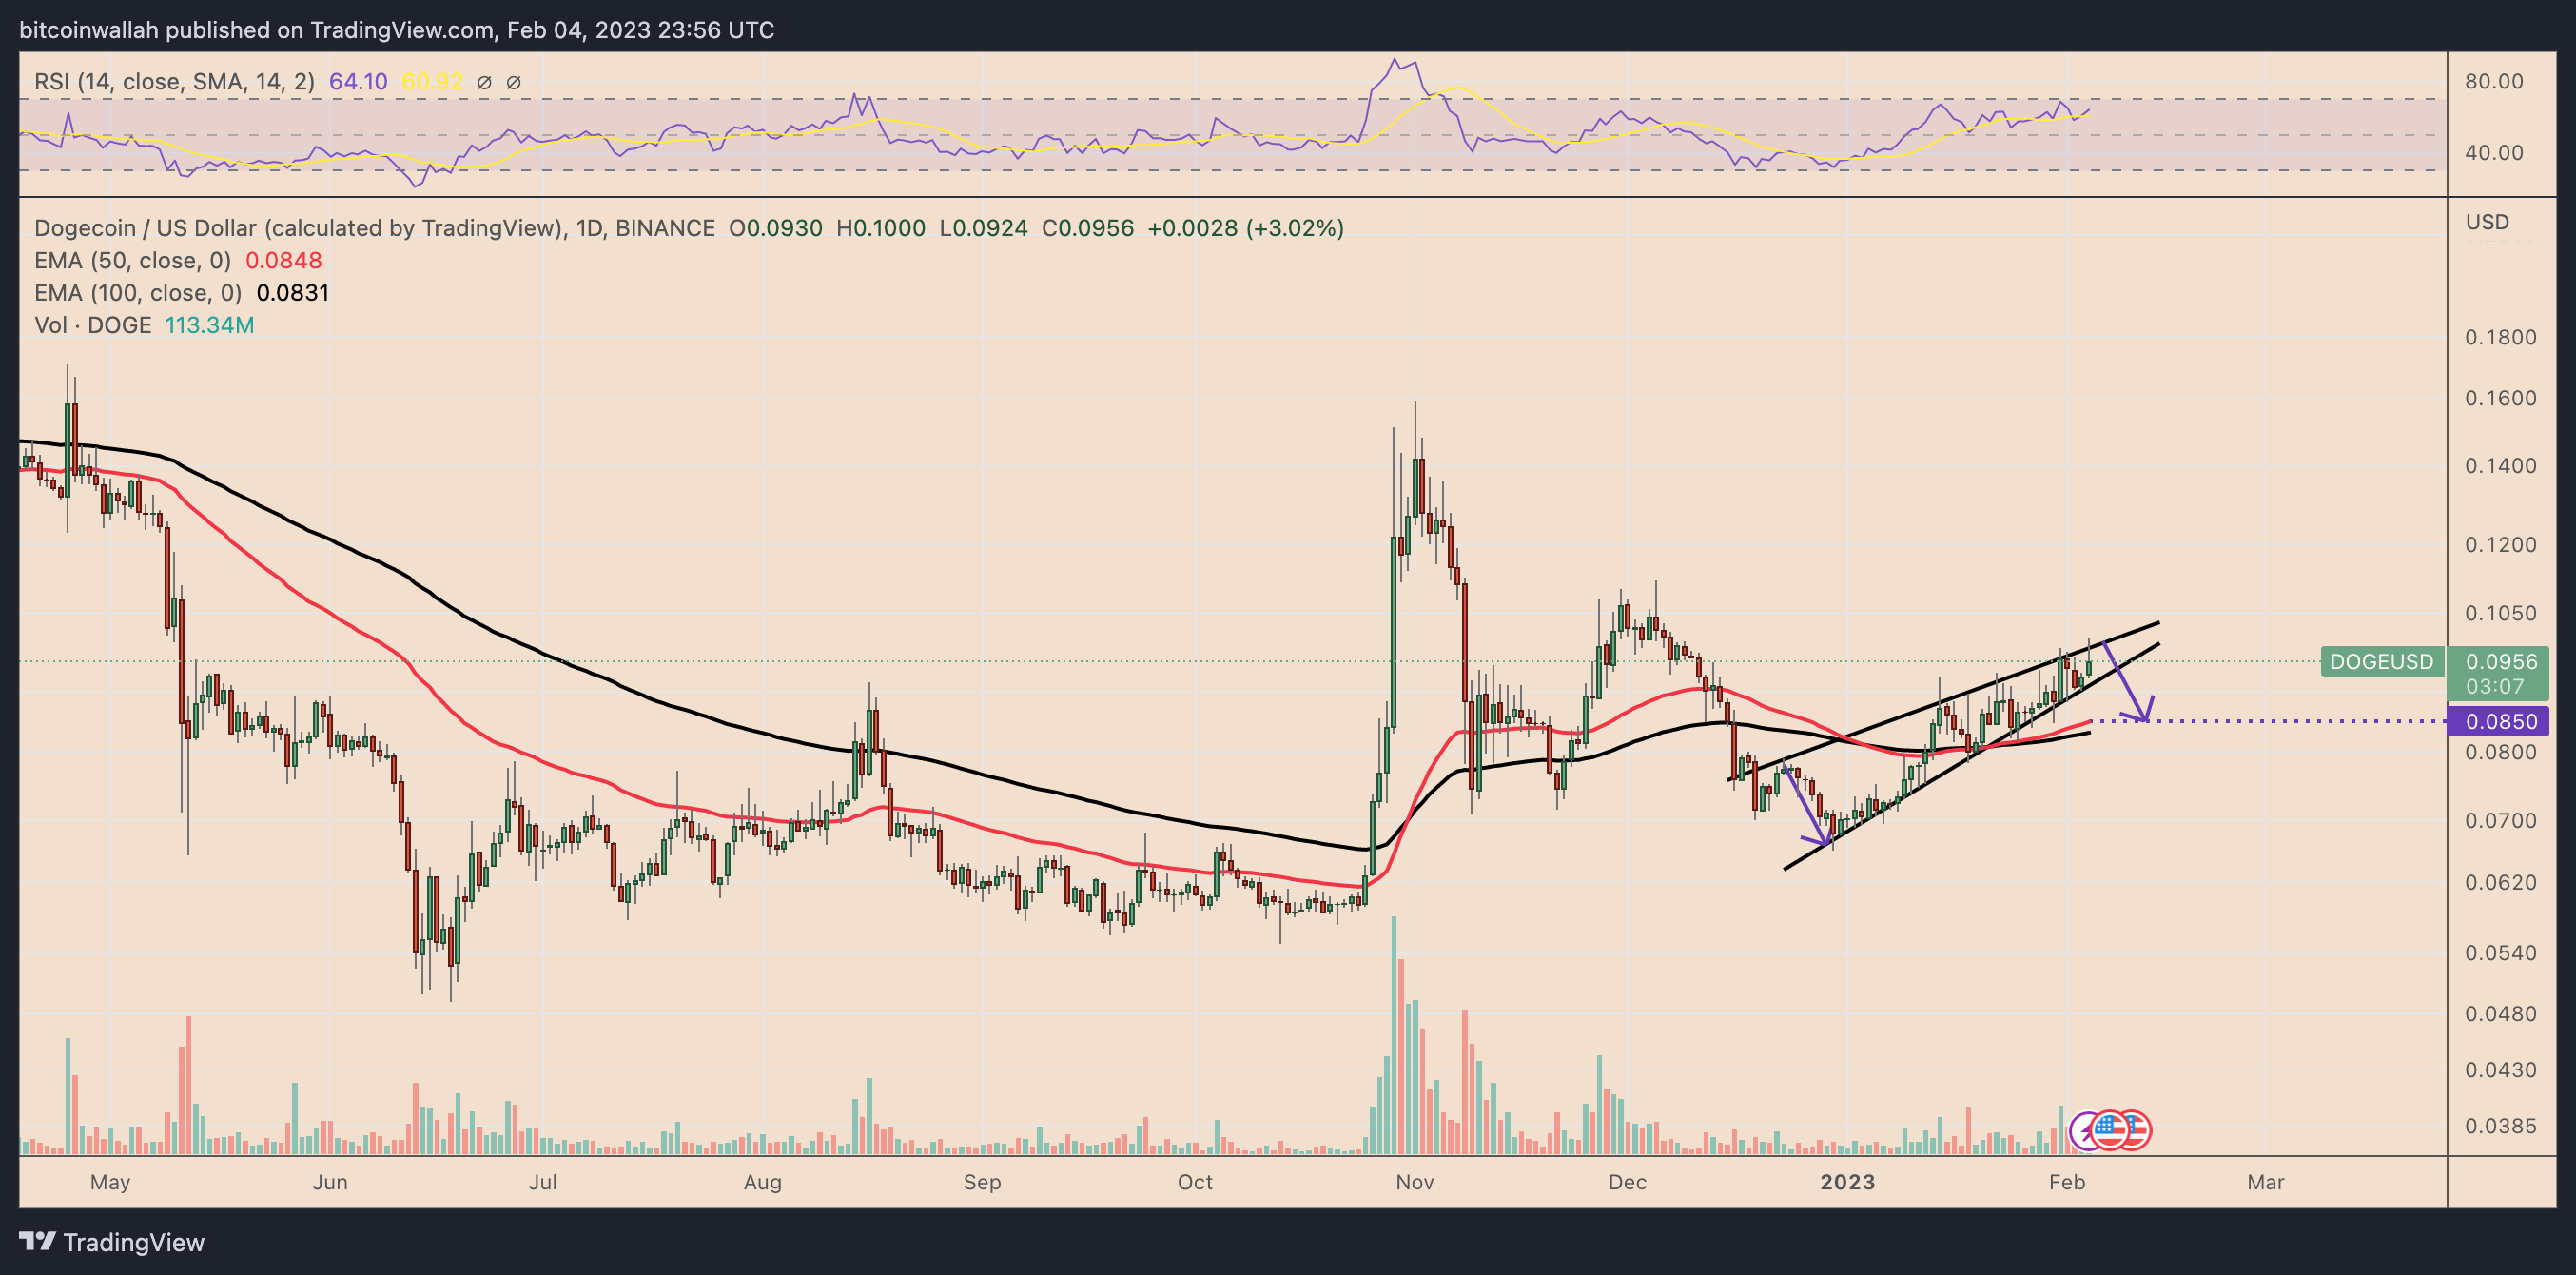
For instance, Dogecoin risks a small correction versus the dollar in coming days as it paints a potential rising wedge pattern.
Rising wedges are bearish reversal patterns showing the price rising inside two converging, ascending trendlines. They resolve after the price breaks below the lower trendline and falls by as much as the wedge’s maximum height.
Applying the scenario on the daily DOGE price chart brings its downside target to $0.0850, down 10% from current price levels

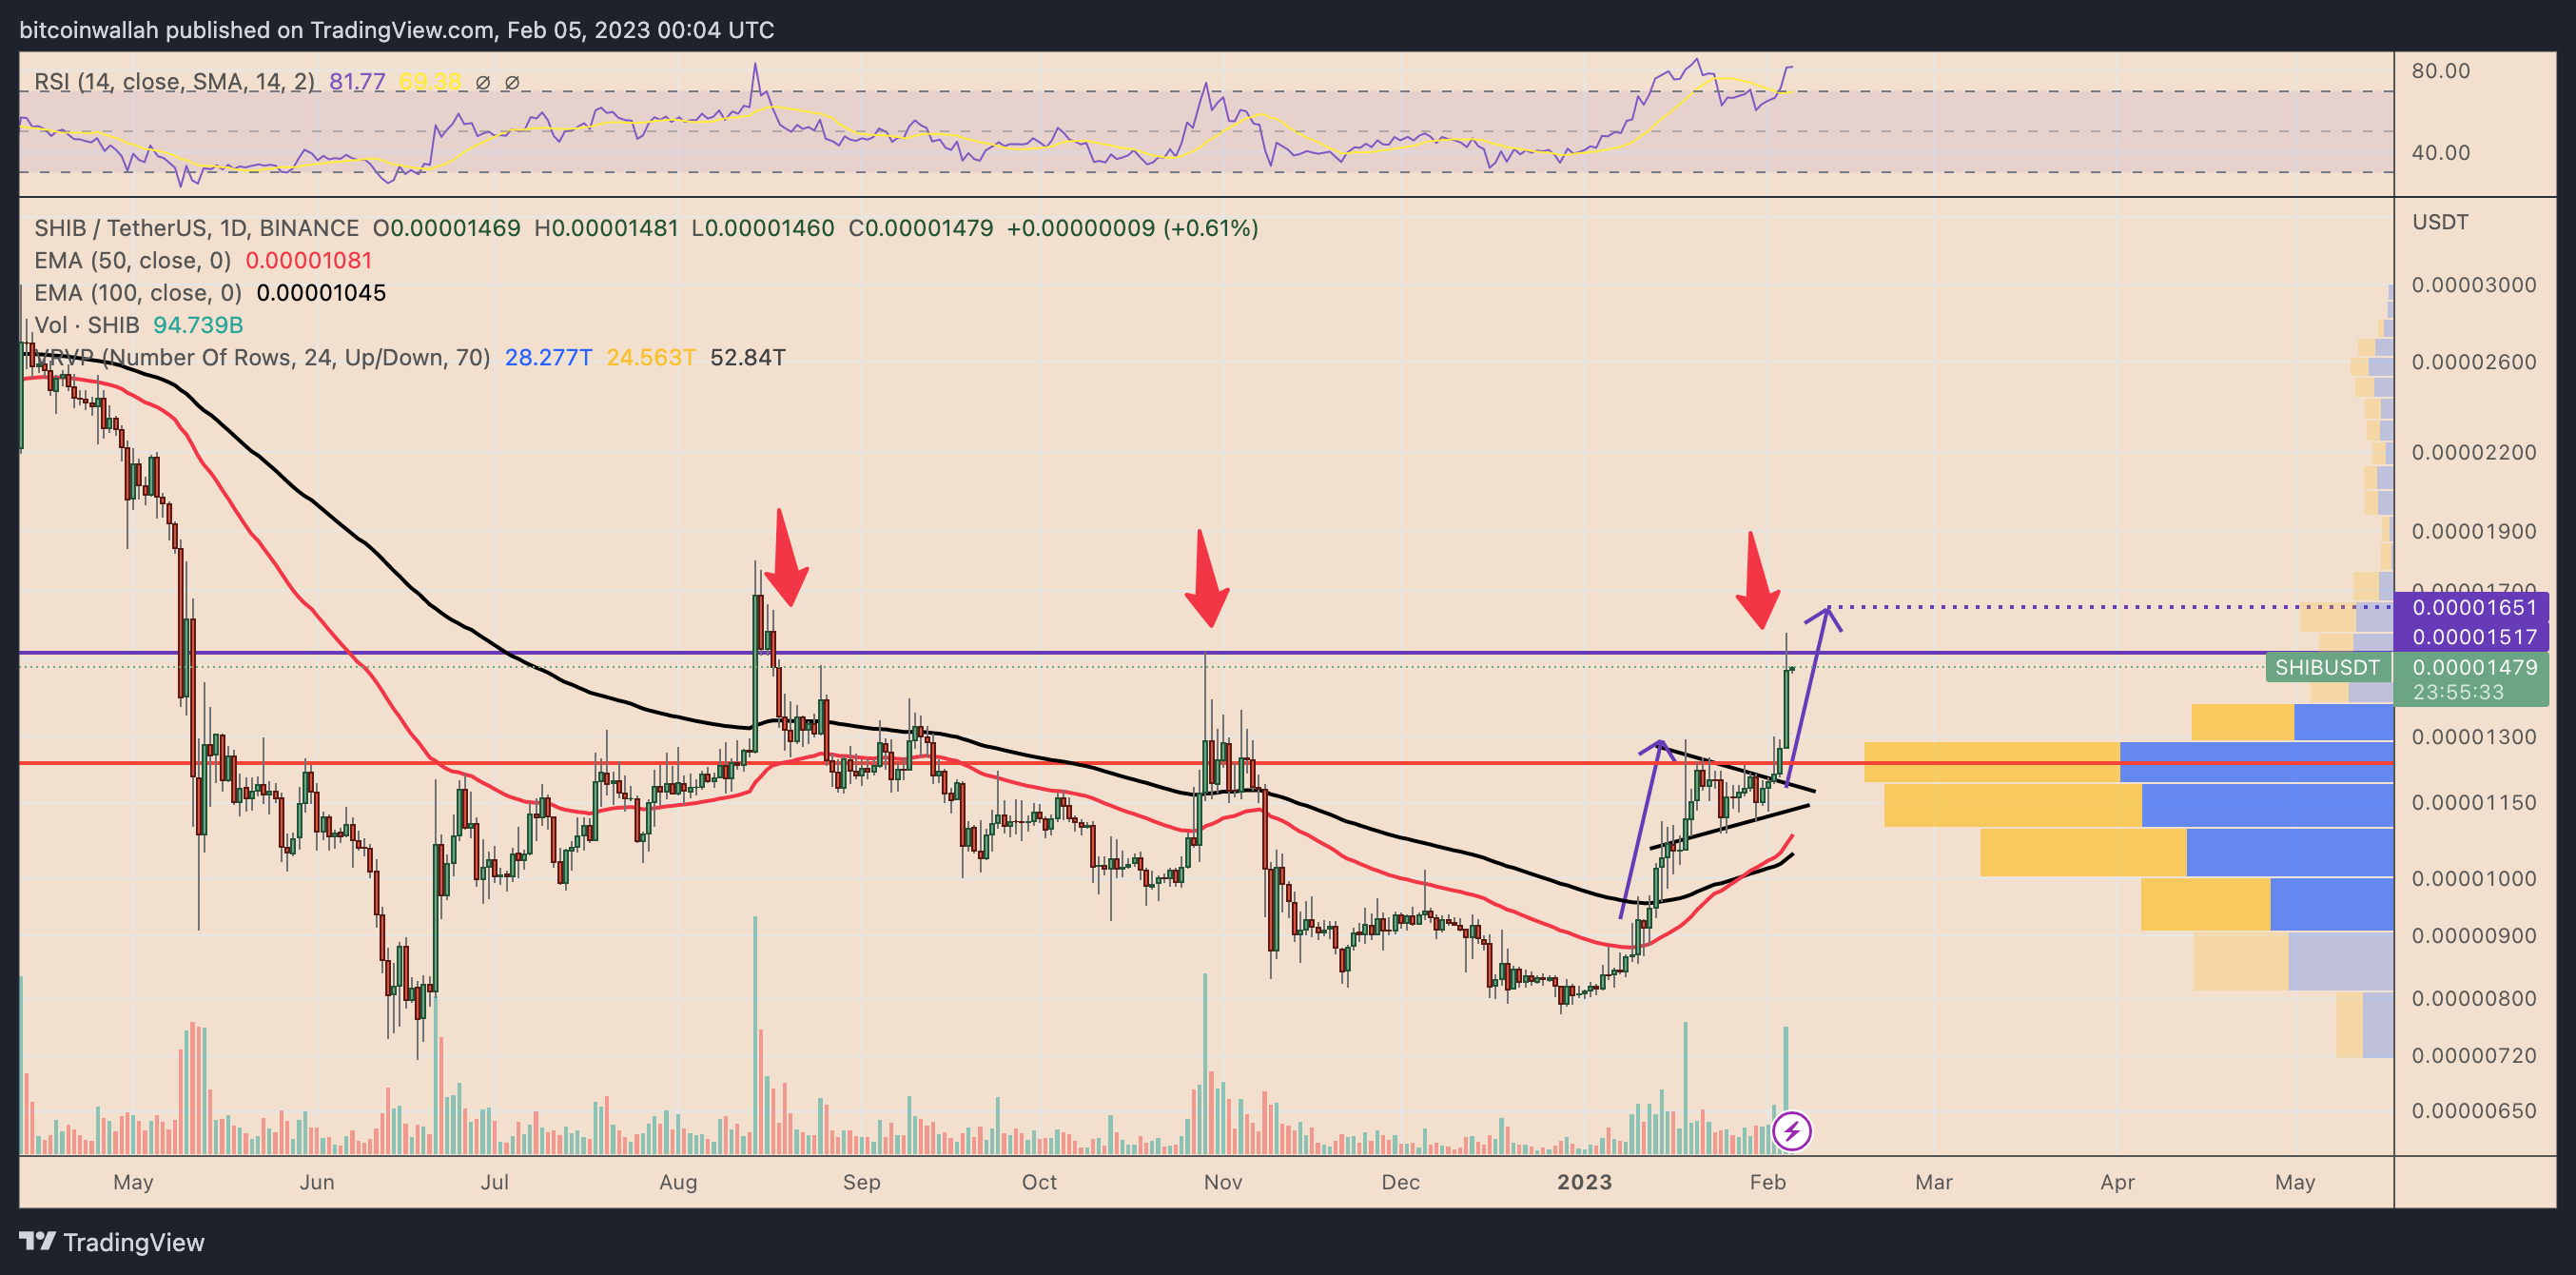
Meanwhile, SHIB/USD also looks overstretched on its daily chart, based on its relative strength index of 81 — higher than 70 is considered “overbought.”
In addition, it’s now facing a strong resistance zone at around $0.00001517 where a pullback is likely. If this is the case, February could see SHIB price drop to $0.00001300-$0.000013000 — its most voluminous area in recent months, down 13%-20% from current price levels.

Conversely, a break above the $0.00001517-resistance would position SHIB for a run to $0.00001651, the upside target of its prevailing bull pennant setup.
This article does not contain investment advice or recommendations. Every investment and trading move involves risk, and readers should conduct their own research when making a decision.


