
Amid the bullish sentiment in the crypto market, Shiba Inu (SHIB) has recently garnered significant attention from traders and investors. A recent analysis by renowned crypto analyst Ali Martinez has spotlighted a rare buy signal for the token, potentially hinting at an upward trajectory for its price.
Buy Shiba Inu Now?
For those not familiar, the TD Sequential is an indicator used by traders to identify potential price patterns and reversals. Developed by Tom DeMark, the TD Sequential is a series of numbers and letters that represent specific counts on a price chart.
When the count reaches a ‘9’ (TD9), it typically suggests a potential reversal in the market’s current trend, whether bullish or bearish. Its utility in predicting market turns has made it a staple in many traders’ toolkits, especially in the realm of cryptocurrencies.
Ali Martinez, in a recent tweet, pointed out that the TD Sequential has flashed a buy signal on the Shiba Inu’s weekly chart. Such an occurrence isn’t just significant due to the potential for a bullish turn but also because of the infrequency of these signals.
Historical data analysis reveals that in the last two instances when such a buy signal manifested, the SHIB price surged by 118% and 71%, respectively. These past performances, while no guarantee of future results, do provide a tantalizing backdrop to the current scenario.
Martinez stated:
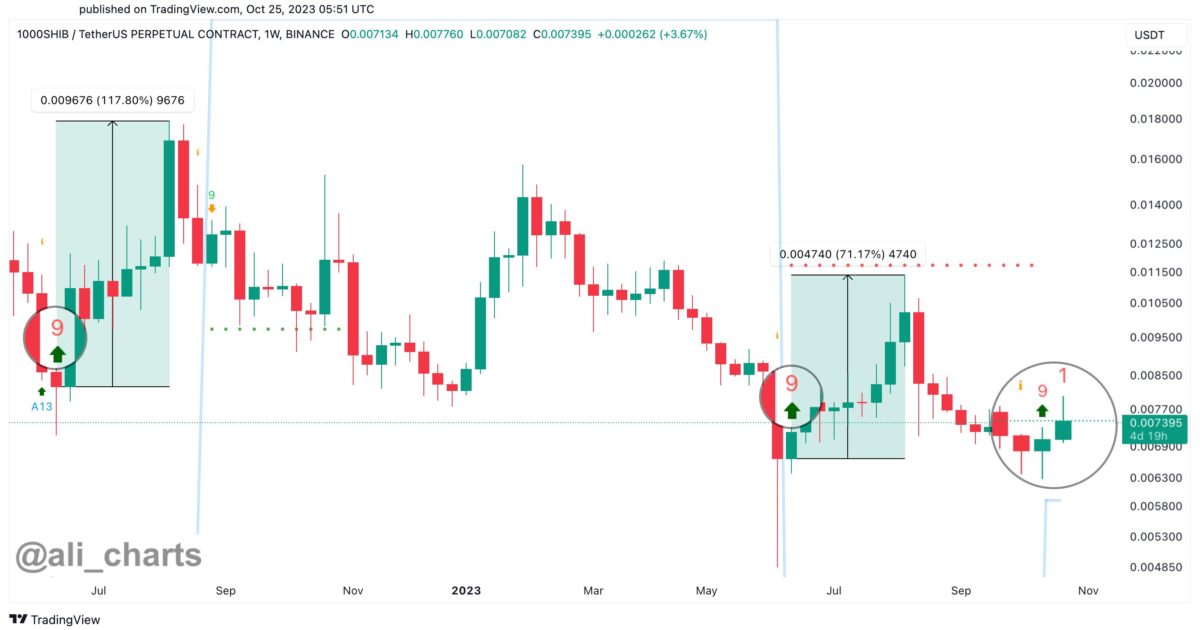
The TD Sequential flashed a buy signal on [the] SHIB weekly chart. Notably, the previous two bullish turns from this indicator led to price surges of 118% and 71%, respectively. Given the infrequency yet precision of such signals, it’s a pivotal moment to keep a keen eye on SHIB.
The TradingView chart, shared by Martinez, outlines the SHIB/TetherUS (USDT) Perpetual Contract on the Binance platform. It shows that back in June 2022, Shiba Inu recorded an impressive surge of approximately 117.80% within eight weeks. This rally was preceded by a ‘9’ candlestick on the TD Sequential indicator, hinting at the buy setup.
In late September 2023, another TD Sequential ‘9’ buy signal emerged, resulting in a 71.17% ascent in SHIB’s value within the subsequent nine weeks. As of October 25, 2023, yet another ‘9’ buy setup has manifested on the weekly time frame. Given the token’s historical reaction to these setups, a bullish move seems likely.
However, while the TD Sequential is a respected tool, it’s worth noting that all indicators should be used in conjunction with other tools and analysis methods. The volatile nature of the crypto market means that predictions, even when based on historically successful indicators, come with inherent risks.
A Consistent Signal
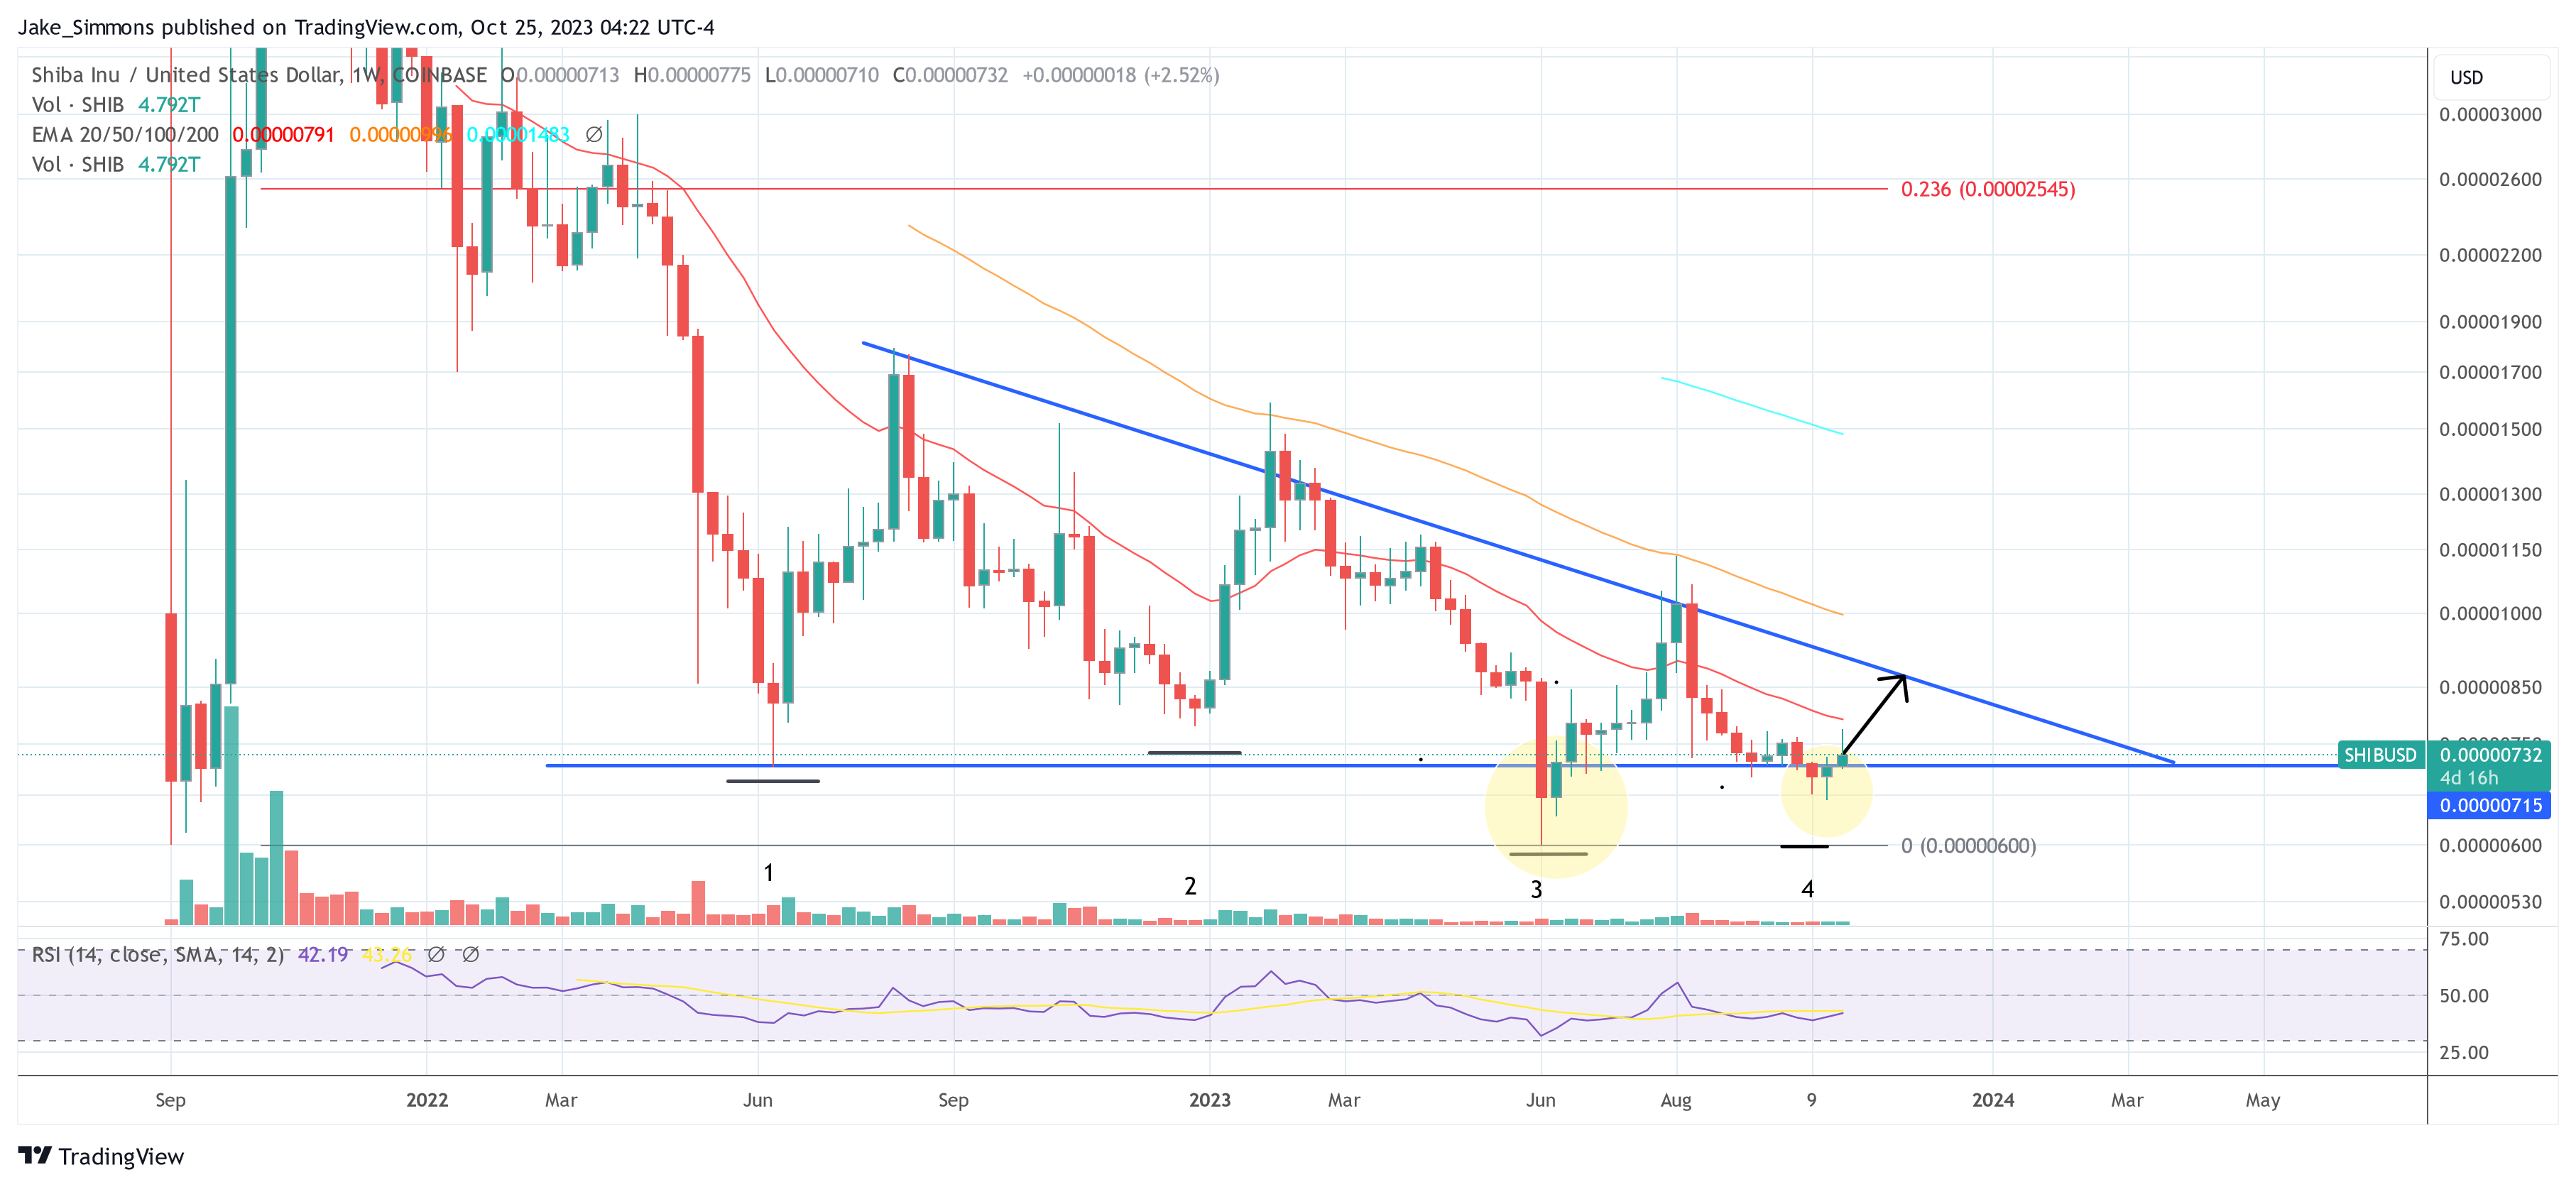
At press time, the Shiba Inu price was trading at $0.00000732 and has thus managed to recapture the neckline of the descending triangle in the weekly chart. As detailed in earlier analysis, SHIB was in a make-or-break moment in the last two weeks. However, since SHIB was able to bounce above the neckline, the bullish scenario has now come to the fore.
As was the case from June to early August 2022 after the formation of the third bottom (yellow circle), SHIB could now rally again towards the descending trend line of the triangle as a result of the fourth bottom (second yellow circle).
Thus, the TD9 signal and this technical pattern coincide. As then, however, a new decisive moment would come for the Shiba Inu price – the battle to break out of a more than 2-year downtrend.
Featured image from Shutterstock, chart from TradingView.com


