

The Shiba Inu (SHIB) price has emerged from a persistent downtrend that dominated the past two months. A detailed analysis of the daily and weekly (SHIB/USD) charts indicates a series of critical technical factors that are currently influencing SHIB’s price movements.
Shiba Inu Bulls Take Over
On the daily chart, SHIB has broken through the upper boundary of the descending channel pattern that had been in place since the high at $0.00001193 reached in mid-December last year. This channel, characterized by lower highs and lower lows, had been containing the price action, but a recent surge in volume and buying pressure has allowed SHIB to breach this confinement.
The breakout was confirmed by a close above the 200-day Exponential Moving Average (EMA, blue line), which is now acting as a support level. However, with the 20-day, 50-day, and 100-day EMAs converging just above current price levels (between $0.00000912 and $0.00000932), the bulls still have some work to do.
Notably, the Fibonacci retracement levels, drawn from the peak to the trough of the recent major move, reveal the following key price levels: the 0.236 level at $0.00000878 is still the most important support, followed by the 0.382 level at $0.00001050, the 0.5 level at $0.00001189, and the 0.618 level at $0.00001328 as the next crucial price targets. These levels often act as resistance during recoveries and, as such, are important targets for traders to watch.
The Relative Strength Index (RSI) on the daily chart is hovering around the 51 mark, indicating a neutral momentum with a slight bias towards buying pressure. This leaves room for the RSI to climb before reaching overbought conditions, which are typically considered to be above the 70 level.
End Of The Consolidation Phase?
On the weekly time frame, a larger trend line, which is providing support derived from an ascending triangle pattern, suggests a longer-term bullish sentiment underlying the recent bearish phase. This support line is critical as it has been respected numerous times in the past, making it a significant level for long-term holders.
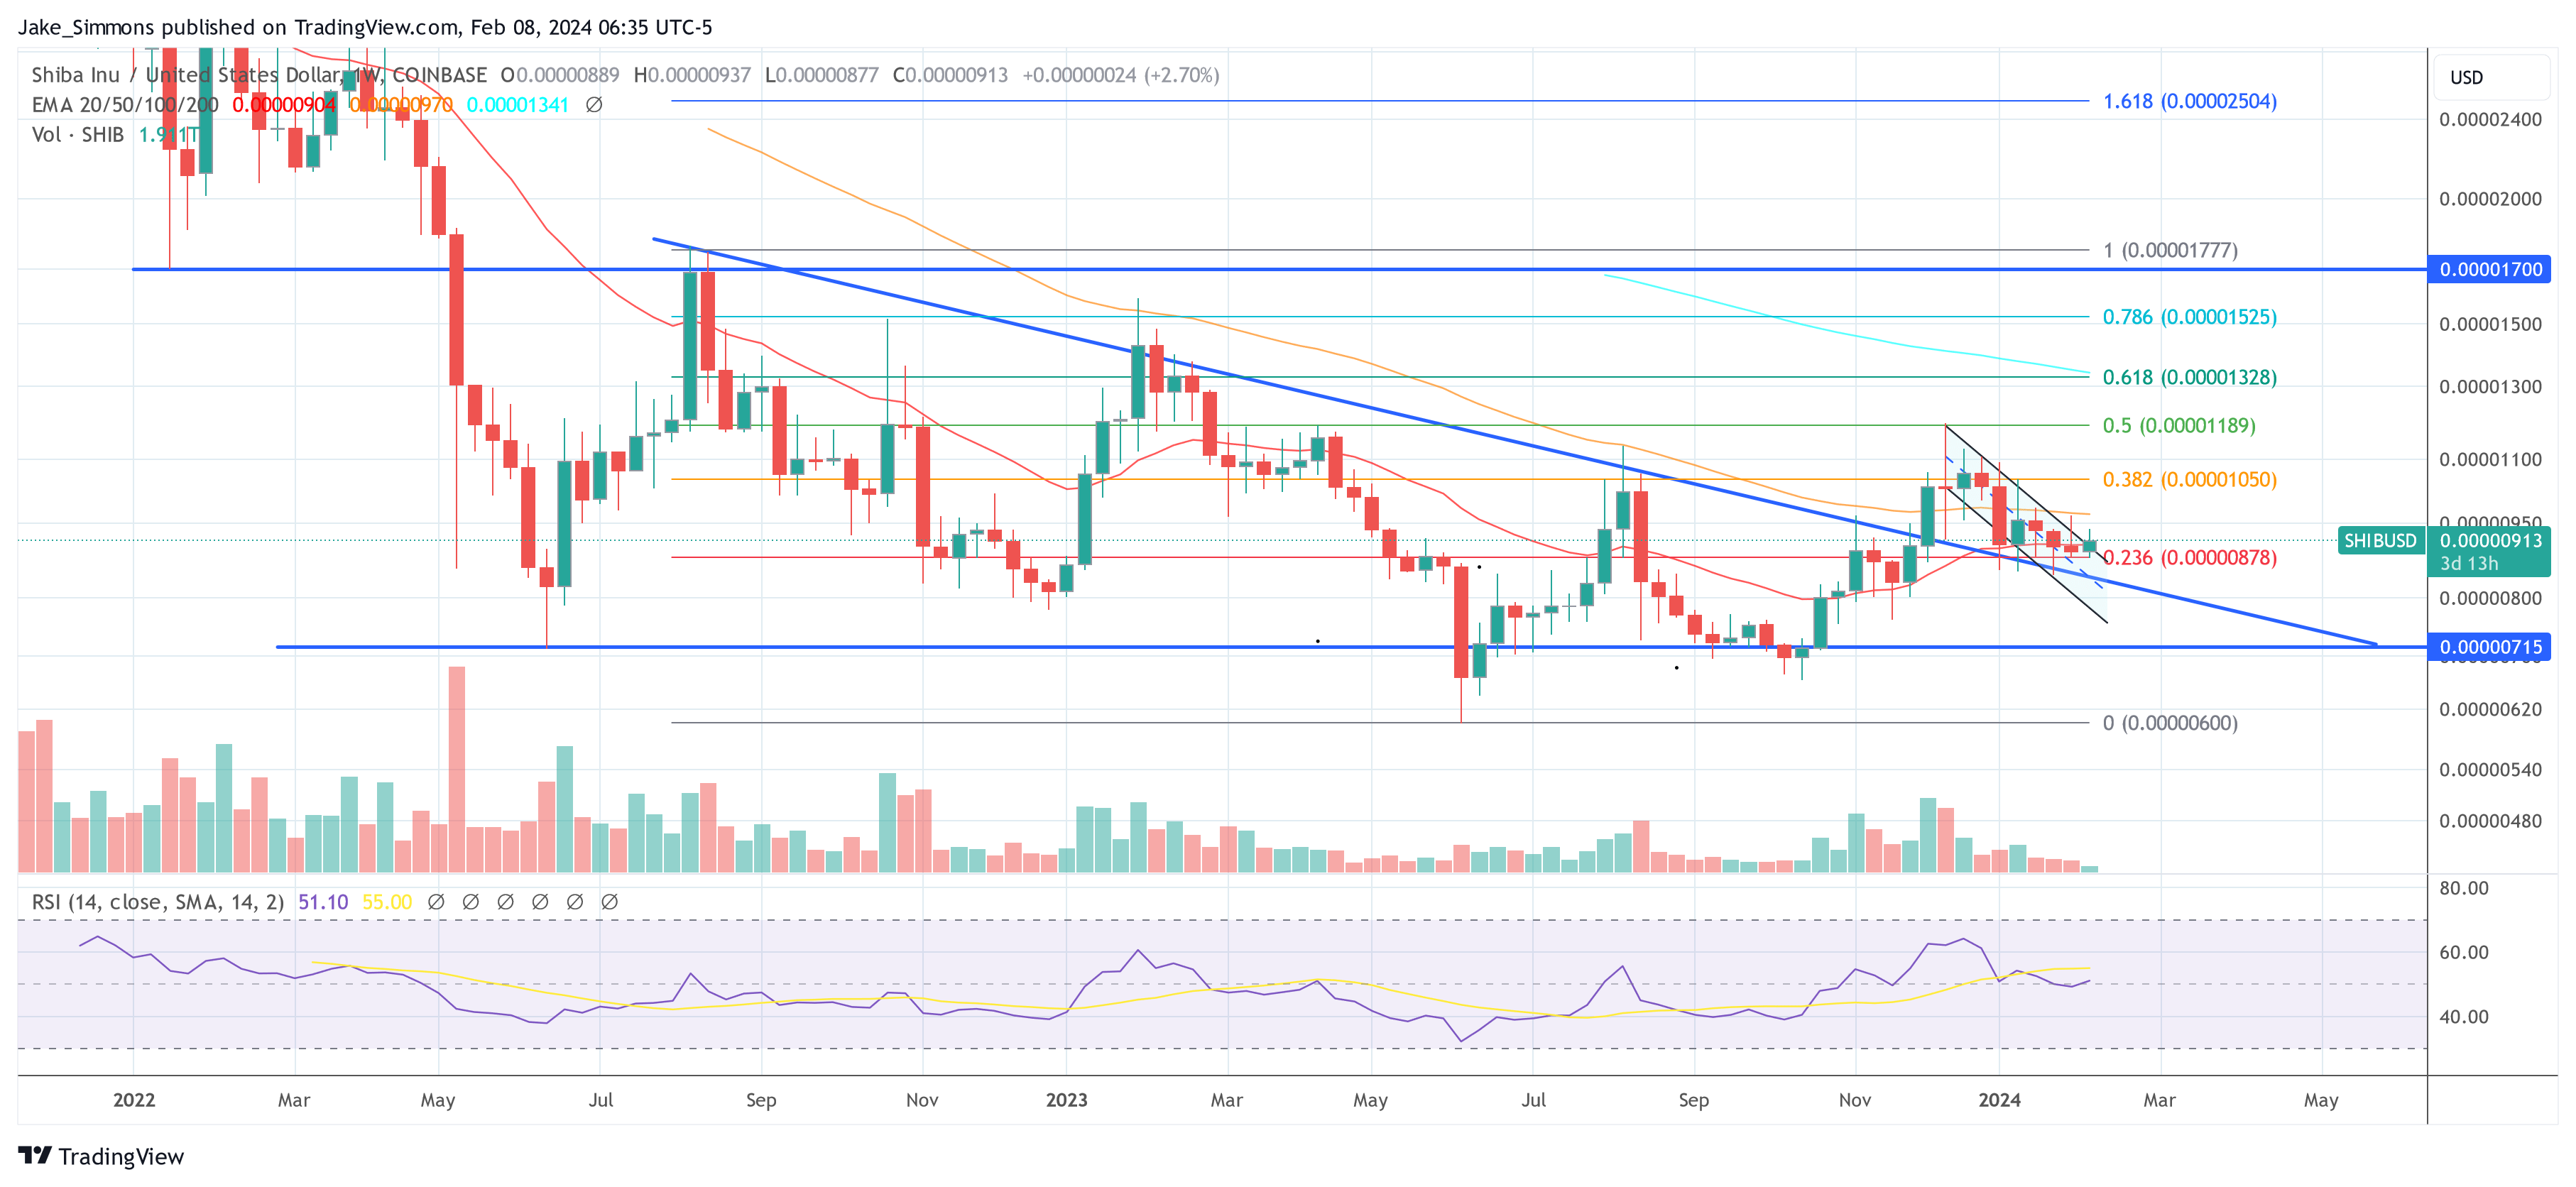
A decisive weekly close above the 20-week EMA at $0.00000904 this Sunday could pave the way for significant momentum. Subsequently, attention shifts to the 50-week EMA at $0.00000970, signaling potential further advances.
The volume profile on both time frames has been relatively high during the breakout, providing further confirmation of the move. However, traders should be cautious as high volume can also precede volatility and potential price retracements.
In summary, SHIB has exhibited a clear breakout from a two-month downtrend with immediate support and resistance levels identifiable through EMAs and Fibonacci retracements. Traders and investors should be closely monitoring these levels to gauge the sustainability of the breakout and the potential for a trend reversal.
Featured image from Shutterstock, chart from TradingView.com
Disclaimer: The article is provided for educational purposes only. It does not represent the opinions of NewsBTC on whether to buy, sell or hold any investments and naturally investing carries risks. You are advised to conduct your own research before making any investment decisions. Use information provided on this website entirely at your own risk.


