

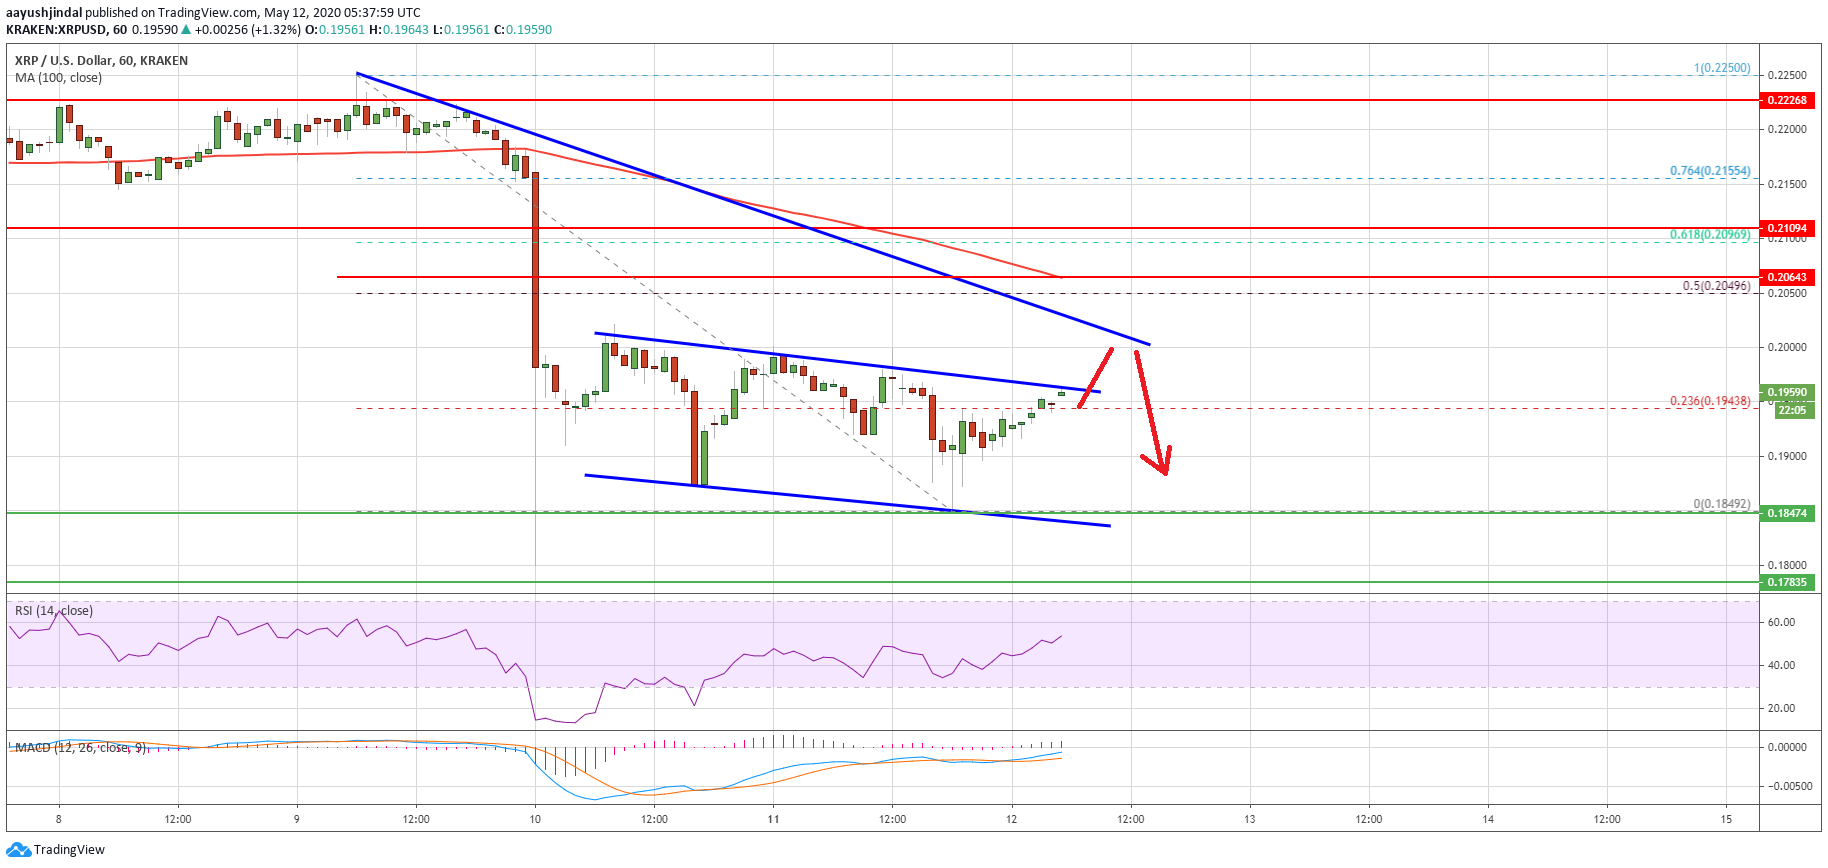
Ripple traded to a new weekly low at $0.1849 and currently correcting higher against the US Dollar. XRP is likely to face a major resistance near the $0.2000 and $0.2050 levels.
- Ripple is showing signs of an upside correction from the $0.1850 swing low against the US dollar.
- The price is currently trading above $0.1920, but it is facing many hurdles near $0.2000.
- There is a major declining channel forming with resistance near $0.1960 on the hourly chart of the XRP/USD pair (data source from Kraken).
- The pair could rise towards $0.2000 or $0.2050, where sellers are likely to take a stand.
Ripple Price Recovery Could Fail Soon
In the past few sessions, ripple followed a bearish pattern and extended its decline below $0.1880. XRP price traded to a new weekly low at $0.1849 and settled well below the 100 hourly simple moving average.
It is currently correcting higher and trading above the $0.1920 resistance. There was a break above the 23.6% Fib retracement level of the main decline from the $0.2250 high to $0.1849 low.
The price is currently facing hurdles near the $0.1960 level. There is also a major declining channel forming with resistance near $0.1960 on the hourly chart of the XRP/USD pair.
The current price action suggests that ripple could rise above the channel resistance and $0.1980. However, there are many hurdles waiting on the upside near the $0.2000 and $0.2050 levels.
The main hurdle is near the $0.2050 level since it is close to the 100 hourly simple moving average. The 50% Fib retracement level of the main decline from the $0.2250 high to $0.1849 low is also near the $0.2049 level to stop the bulls.
To move into a positive zone, XRP price must climb above the $0.2000 resistance and then gains bullish momentum above the $0.2050 resistance zone.
Bearish Scenario for XRP
If ripple struggles to correct above the $0.1960 and $0.2000 resistance levels, there are chances of more downsides in XRP. The first support is seen near the $0.1900 level.
The main support is now forming near the $0.1850 level, below which there are high chances of an extension towards the $0.1780 and $0.1750 levels.
Technical Indicators
Hourly MACD – The MACD for XRP/USD is slowly gaining pace in the bullish zone.
Hourly RSI (Relative Strength Index) – The RSI for XRP/USD is currently well above the 50 level.
Major Support Levels – $0.1920, $0.1880 and $0.1850.
Major Resistance Levels – $0.1960, $0.2000 and $0.2050.
Take advantage of the trading opportunities with Plus500
Risk disclaimer: 76.4% of retail CFD accounts lose money.


