

- Ripple price is holding a couple of important supports near $0.2180 and $0.2150 against the US dollar.
- The price is currently facing resistance near the $0.2260 and $0.2300 levels.
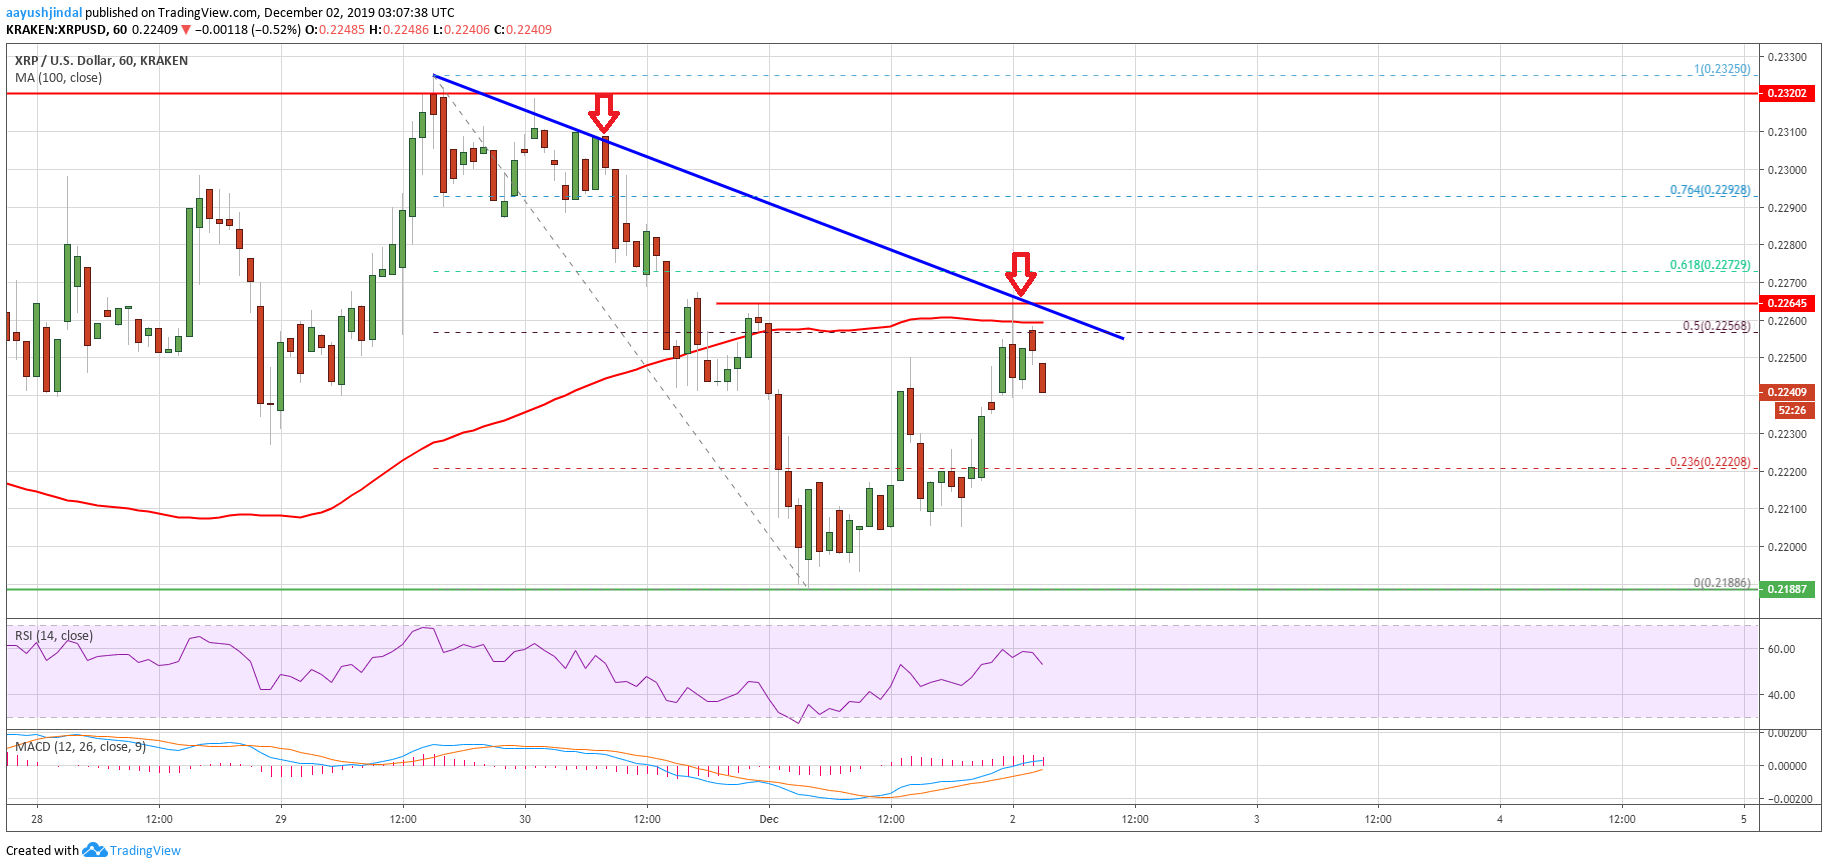
- There is a major bearish trend line forming with resistance near $0.2260 on the hourly chart of the XRP/USD pair (data source from Kraken).
- The pair needs to climb above the $0.2260 and $0.2300 resistance levels to continue higher.
Ripple price is struggling to gain bullish momentum against the US Dollar and bitcoin. XRP price might revisit the $0.2180 or $0.2150 support before it climbs higher.
Ripple Price Analysis
After forming a local top near the $0.2320 level, ripple started a fresh decline against the US Dollar. XRP price declined below the $0.2250 support level and the 100 hourly simple moving average.
Moreover, the price broke the $0.2200 support and tested the $0.2180 support zone. A low was formed near the $0.2188 and the price recently started an upside correction.
There was a break above the $0.2220 resistance area. Besides, the price climbed above the 23.6% Fib retracement level of the latest decline from the $0.2325 high to $0.2188 low.
However, the price is facing a lot of hurdles near the $0.2250 and $0.2260 resistance levels. It seems like the 50% Fib retracement level of the latest decline from the $0.2325 high to $0.2188 low is acting as a resistance.
More importantly, there is a major bearish trend line forming with resistance near $0.2260 on the hourly chart of the XRP/USD pair. Finally, the 100 hourly simple moving average is acting as a strong resistance near $0.2250.
Therefore, a clear break above the $0.2260 resistance area and the 100 hourly simple moving average could open the doors for more gains. The next major resistance is near the $0.2300 level. It is near the 76.4% Fib retracement level of the latest decline from the $0.2325 high to $0.2188 low.
On the downside, an initial support is near the $0.2220 level. If there is a downside break below $0.2200, the price could continue to decline towards the $0.2180 support. The main support is near the $0.2150 level.
Looking at the chart, ripple price is facing a couple of important resistances near $0.2250. Thus, the bears might eye another decline below the $0.2220 and $0.2200 support levels. Having said that, the bulls might appear if the price tests the $0.2150 support area.
Technical Indicators
Hourly MACD – The MACD for XRP/USD is about to move back into the bearish zone.
Hourly RSI (Relative Strength Index) – The RSI for XRP/USD is currently declining and is just below the 50 level.
Major Support Levels – $0.2220, $0.2200 and $0.2180.
Major Resistance Levels – $0.2250, $0.2560 and $0.2300.

