

Ripple remained in a major downtrend from well above the $0.2650 level against the US Dollar. XRP price tested the $0.2240 support area and it could correct higher in the short term.
- Ripple price is down close to 6% and it broke the $0.2350 support area against the US dollar.
- The price tested the $0.2240 support area and it is currently consolidating losses.
- There is a contracting triangle forming with resistance near $0.2300 on the hourly chart of the XRP/USD pair (data source from Kraken).
- The price must climb above the $0.2300 level to start a recovery towards the $0.2450 level.
Ripple Price Could Correct Higher
Recently, we saw a strong decline in ripple from well above the $0.2650 level. XRP price broke many supports near $0.2500 and $0.2450 levels to enter a short term downtrend.
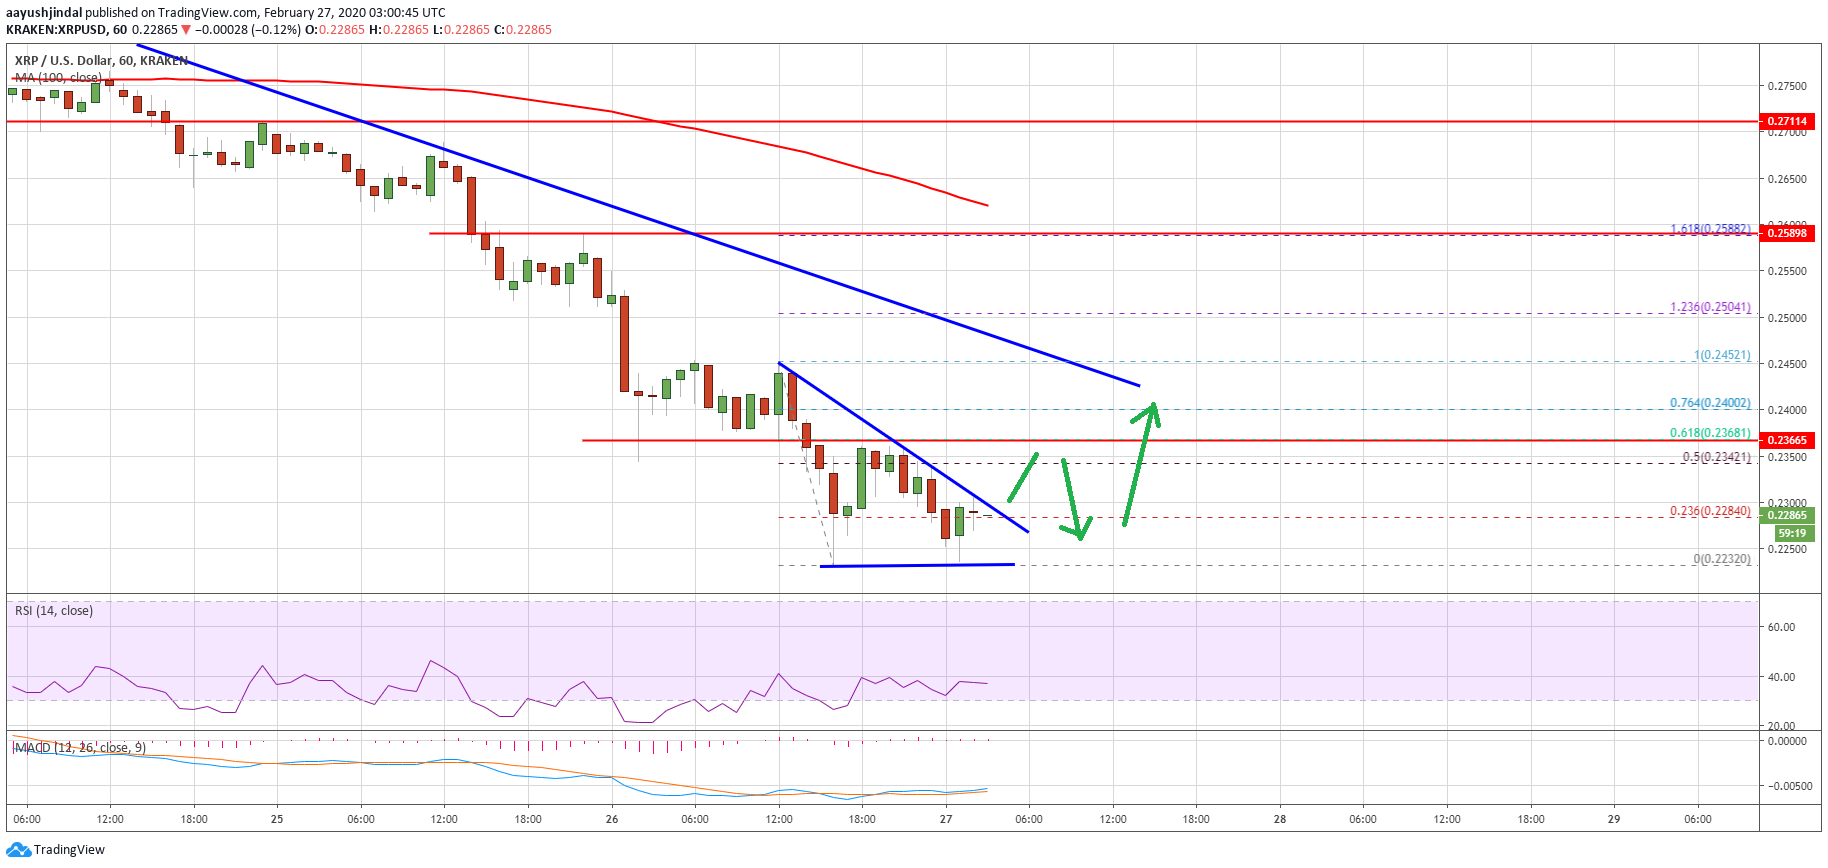
Moreover, there was a break below the $0.2350 support level and the price settled well below the 100 hourly simple moving average. The decline was such that the price traded below the $0.2280 level.
Finally, it found support near the $0.2240 level and it is currently consolidating losses. A weekly low is formed near $0.2232 and the price is testing the 23.6% Fib retracement level of the recent slide from the $0.2452 high to $0.2232 low.
More importantly, there is a contracting triangle forming with resistance near $0.2300 on the hourly chart of the XRP/USD pair. Therefore, a clear break above the triangle resistance could open the doors for a decent recovery in ripple towards the $0.2400 and $0.2450 levels.
An intermediate resistance is near the $0.2365 level. It is close to the 50% Fib retracement level of the recent slide from the $0.2452 high to $0.2232 low.
Finally, ripple price must climb above the $0.2450 and $0.2500 resistance levels to start a fresh increase in the coming days.
More Losses?
If ripple fails to correct above the $0.2300 and $0.2365 resistance levels, it could continue to move down. The first key support on the downside is near the $0.2240 level.
If there is a clear break below $0.2240 and $0.2232, the price could move down towards the $0.2200 level. Any further losses is likely to lead the price towards the $0.2050 level in the near term.
Technical Indicators
Hourly MACD – The MACD for XRP/USD is still showing many bearish signs.
Hourly RSI (Relative Strength Index) – The RSI for XRP/USD is currently well below the 40 level, with bearish angle.
Major Support Levels – $0.2240, $0.2200 and $0.2050.
Major Resistance Levels – $0.2300, $0.2365 and $0.2450.


 Bulls Strengthen Market Control With 13% Rally")