

Ripple is down more than 5% and it broke the $0.1550 support region against the US Dollar. However, XRP price is still trading nicely above the key $0.1450 and $0.1420 support levels.
- Ripple price started a fresh decline from the $0.1620 resistance area against the US dollar.
- The bears were able to push the price below the $0.1550 and $0.1500 support levels.
- There is a key bearish trend line forming with resistance near $0.1540 on the hourly chart of the XRP/USD pair (data source from Kraken).
- The price is likely to remain well bid above the $0.1450 and $0.1420 support levels in the near term.
Ripple Price is Holding Key Supports
After retesting the $0.1450 support area, ripple failed to continue above the $0.1620 resistance. XRP price made a couple of attempts to surpass the $0.1620 barrier, but it failed.
As a result, there was a fresh decline below the $0.1550 support level. The price even broke the $0.1500 support level and settled well below the 100 hourly simple moving average.
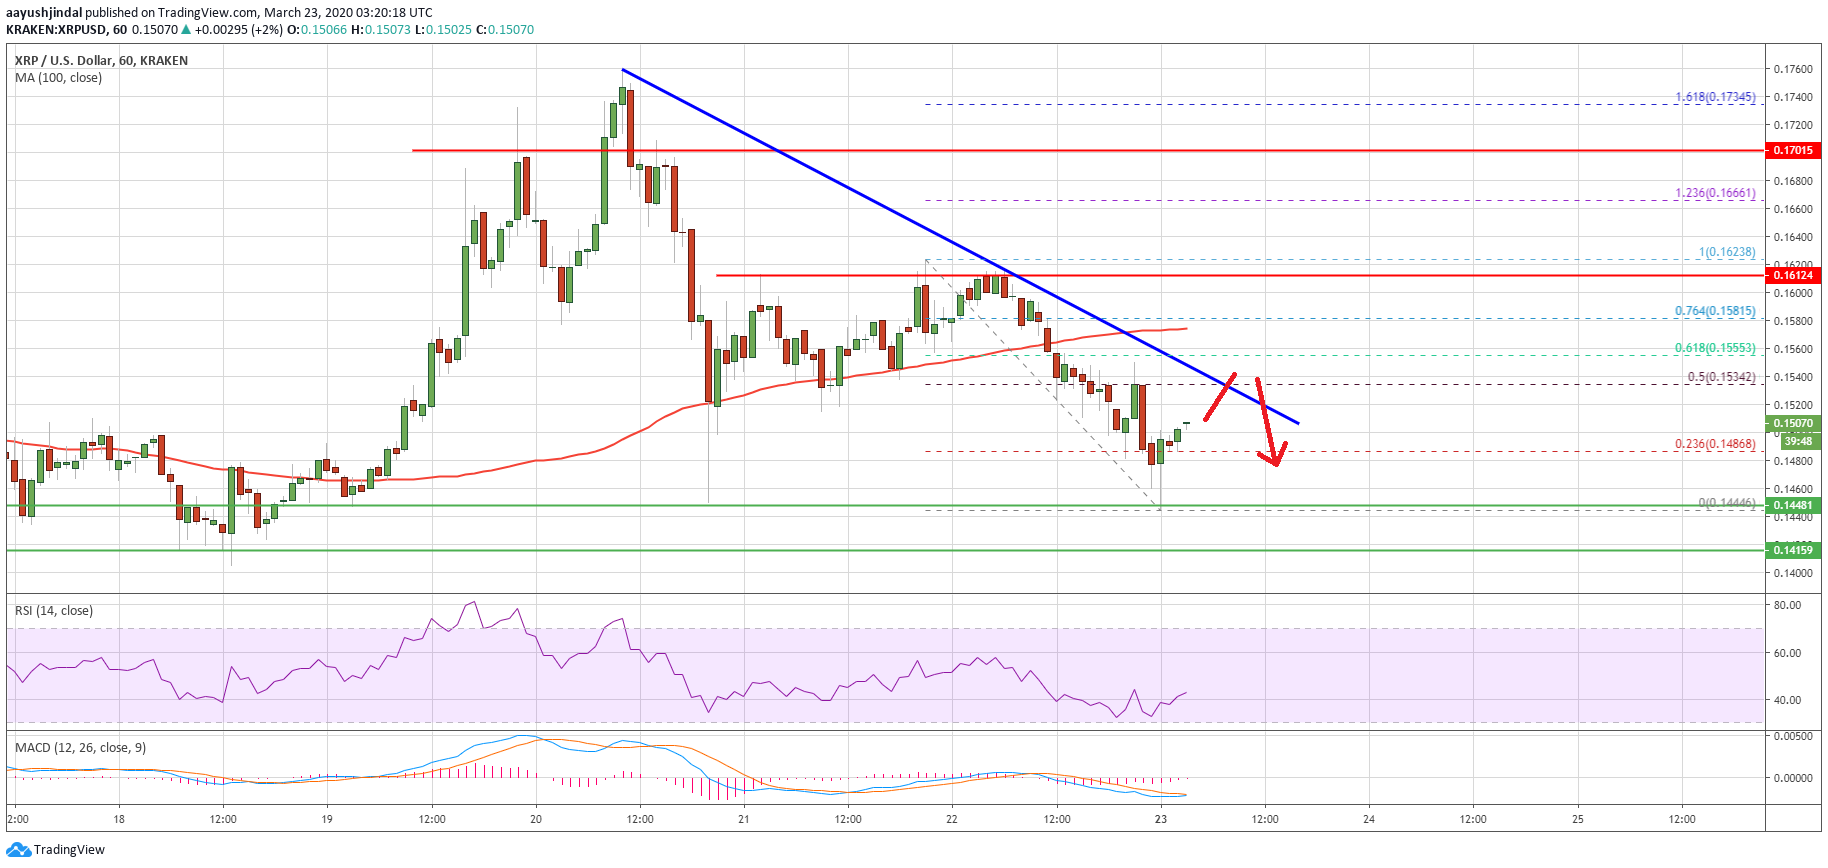
A low is formed near the $0.1446 and it seems like ripple price is well bid above the $0.1450 support. It is currently trading higher above the 23.6% Fib retracement level of the recent decline from the $0.1623 high to $0.1446 low.
An initial resistance is near the $0.1535 level. There is also a key bearish trend line forming with resistance near $0.1540 on the hourly chart of the XRP/USD pair. The trend line is close to the 50% Fib retracement level of the recent decline from the $0.1623 high to $0.1446 low.
Above the trend line, the next resistance is near the $0.1580 level and the 100 hourly SMA. The main hurdle is still near $0.1620, above which the price is likely to rise steadily towards the $0.1750 level.
Chances of a Downside Break
On the downside, the main support for ripple is near the $0.1450 level, below which it could is likely to test the $0.1420 support area.
If the bears manage to lead the price below the $0.1450 and $0.1420 support levels, it could spark an increase in selling. The next major support is seen near the $0.1350 level.
Technical Indicators
Hourly MACD – The MACD for XRP/USD is slowly moving back into the bullish zone.
Hourly RSI (Relative Strength Index) – The RSI for XRP/USD is currently correcting higher towards the 45 level.
Major Support Levels – $0.1450, $0.1420 and $0.1350.
Major Resistance Levels – $0.1535, $0.1580 and $0.1620.


 Continues To Lag In Price; SOL Must Do This One Thing To Rally")