Bitcoin has now retraced as much as $11,000 and 27% from its 2021 peak, and while the current high might not be the top for this bull run, it could send price action headed downwards for a few weeks before the uptrend resumes.
Bulls have only days to prevent a bearish evening star reversal pattern from forming on weekly timeframes, which could dim the bullish momentum the cryptocurrency has had thus far this year for at least a few weeks.
Bearish Reversal Pattern Could Dim The Lights On Recent Bull Run
Bitcoin fell to under $31,000 today in one of the largest red daily candles in the asset’s history. The now $11,000 and increasing by the minute decline has resulted in shaving as much as 27% off of the price per BTC from highs set earlier this year.
Related Reading | Career Trader Subtly Hints Of Bitcoin Parabola Breakdown With Fractal Diagram
The top cryptocurrency has recovered nearly $1,000 from the day’s low, but there’s now a chance that bears have taken back control of the trend on higher timeframes.
Bitcoin could be forming an evening star bearish reversal pattern on weekly timeframes | Source: BTCUSD on TradingView.com
If by Sunday night bulls cannot push the price of Bitcoin back above $35,000, an evening star pattern will form on weekly timeframes. Evening star patterns are a bearish Japanese candlestick reversal formations, that tend to form at the peak of an uptrend.
A similar pattern signaled the top at $42,000 on daily timeframes, and is now at risk of extending into weekly timeframes as well.
Where The Top Cryptocurrency Could Correct To: The Mid-BB
The higher the timeframe the technical signal, the stronger the results. The initial daily evening star was the turning point of the trend, and now weekly timeframes are tumbling also.
But because monthly timeframes have only recently begun to trend upward, any correction should only last a matter of weeks, not months.
Related Reading | The Striking Similarities Between The 2017 Bitcoin Peak And Now
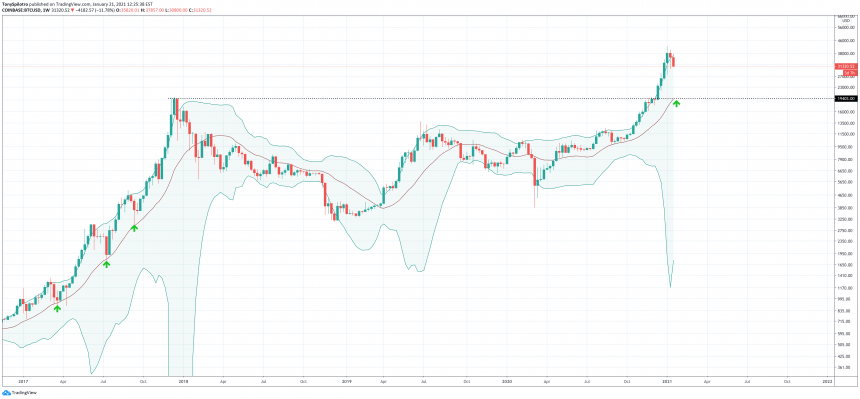
As for where the correction could head from here if the reversal pattern confirms with a close below $35,000, looking at the last bull market suggests the middle-Bollinger Band could act as the perfect point to reignite buying interest.
The middle-BB could act as a logical target for each correction | Source: BTCUSD on TradingView.com
During the last bull market, Bitcoin dropped back to the middle-Bollinger Band – a simple moving average – before rocketing back up higher. It did so three times after the breakout into a new bull market was confirmed.
If the cryptocurrency follows a similar path, this is just correction one of three that could come with further upside on the way to the true high timeframe peak.
Featured image from Deposit Photos, Charts from TradingView.com


