A bloody Monday for the equity and oil markets, as Europe stock markets are dropping by 8%, while oil has seen a drop of 30%. But it’s not only equity markets as the crypto market is also experiencing the same pain with Bitcoin (BTC) dropping $1,500 during the weekend.
Wouldn’t it be expected to see Bitcoin move up during economic instabilities? The opposite seems so, while gold has been showing strength over the past weeks.
Crypto market daily performance. Source: Coin360
Bitcoin can’t break through $9,150 and retraces to $7,500
The price of Bitcoin made a significant drop two weeks ago, as the market experienced a similar $1,500 decline during that week. However, some relief was found during last week, after which another crash occurred following a rejection of $9,150 during the weekend.
BTC USDT 1-day chart. Source: TradingView
The price of Bitcoin had to break through the $9,150-9,300 level to sustain any upwards momentum. However, the test failed, and confirmation of resistance was done.
Ultimately, a test of $8,200 level would warrant any success, but even that level couldn’t provide any support. Leaving the next support zones, after which BTC bounced at the $7,600 level.
As the chart is showing, the $8,200 and $8,500 levels are upper resistance areas, while the $7,300-7,500 area is the main support area lying beneath the current price.
Weekend drop leaves giant CME gap
BTC USD 2-hour CME chart. Source: TradingView
The 2-hour CME chart of Bitcoin is showing a massive gap, created during the volatility at the weekend. However, another vital aspect is shown in this chart. There was still a gap lying in the chart since the beginning of 2020, at $7,600. Due to the massive selloff in the weekend, the gap is filled, which might mention a potential bottom scenario.
Around 95% of the gaps will be filled, eventually. As the market filled this gap, there are still a few gaps open, with the central gap created during the weekend, from $7,900 to $9,100. Another gap is still ready to be filled around the $11,600 level.
Gold outperforming Bitcoin in 2020
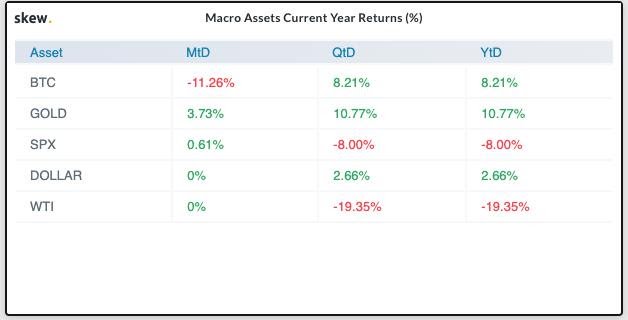
Bitcoin is not currently living up to its “digital gold” monicker. On the other hand, gold itself is maintaining its strength during the current economic meltdown. The price of gold is up by 11.50% in 2020, while the price of Bitcoin is up 8.50% in 2020.
Macro assets current year returns. Source: Skew.com
Both are still massively outperforming the equity markets. The Dutch and German indexes are down 20%, respectively.
Until now, Bitcoin has been showing a significant correlation with the movements on the equity markets. Does that mean that Bitcoin is not a safe haven? No, there’s no conclusion to be drawn out of it.
During the credit crisis of 2008, gold showed a similar retrace as it dropped 30% in a year, alongside equity markets. However, after this, gold outperformed the equity markets massively until the top in 2011.
Through that, investors and traders on the equity markets usually sell their risky assets in order to have the liquidity to cover their equity losses. Bitcoin is the first one to be sold in that scenario.
However, as the gold case is showing, Bitcoin could benefit massively in the coming years, if there’s more trouble on the horizon. But what can the market expect in the short-term?
Total market capitalization ready for the massive support
Total market capitalization cryptocurrency 1-week chart. Source: TradingView
The total market capitalization chart is showing a significant sell-off and rejection at the $300 billion resistance. Through that, the first significant support levels are found in the green zone, between $185 and $205 billion.
It’s likely to expect a continuation towards that support zone for a test, based on the higher time frames. It’s possible to see a short-term bounce occur on the markets. However, supports are there to be tested, and this one is the first large area beneath the current market capitalization.
Bitcoin aiming for $7,300-7,500 as support test
BTC USD 1-week chart. Source: TradingView
The larger time frame of Bitcoin shows a clear downwards structure. Through that, a support test of $7,300-7,500 seems necessary before any support construction can be built. The first significant resistance area above the current price is $8,200. A bearish rejection on that level could indicate further downwards movements and a support test of the $7,300-7,500 levels.
However, if the selloff continues alongside the markets, it wouldn’t be a surprise to see further downwards momentum through which $6,700-6,800 comes in to play.
Short-term relief bounce to $8,200 is expected
BTC USDT 1-day chart. Source: TradingView
Should traders expect the levels of $7,300-7,500 to be hit in one go? Not yet, as the price has been seeing such a giant selloff, a relief rally is not unexpected. The price of Bitcoin is currently resting at the support at $7,800, through which a relief rally could be expected.
For that, the upper resistances are $8,200 and $8,500. These are the levels to be tested and confirmed for resistance. If these are tested, a likely continuation to $7,300-7,500 is expected in the markets.
Is there any confirmation we’ll see such a bounce? No. I’m mainly focused at $7,300-7,500 and also slowly watching whether the equity markets are showing a relief rally. If the equity markets bounce up, similar movements could be expected from Bitcoin.
The views and opinions expressed here are solely those of the author and do not necessarily reflect the views of CryptoX. Every investment and trading move involves risk. You should conduct your own research when making a decision.


