Several short-term buying opportunities might crop up for Bitcoin and other cryptos in the next few days. What are the critical levels to watch out for?
South Korea’s central bank plans to recruit additional digital currency experts to build on its existing research into central bank digital currency (CBDC). Along with its own research, the bank also plans to discuss the developments of CBDCs with the Bank of International Settlements and other international organizations.
While the larger economies are mulling launching or researching about CBDCs, the Central Bank of the Bahamas is expected to launch its digital currency pilot in one of the districts on Dec. 27. It plans to expand the project to another district in the first-half of 2020.
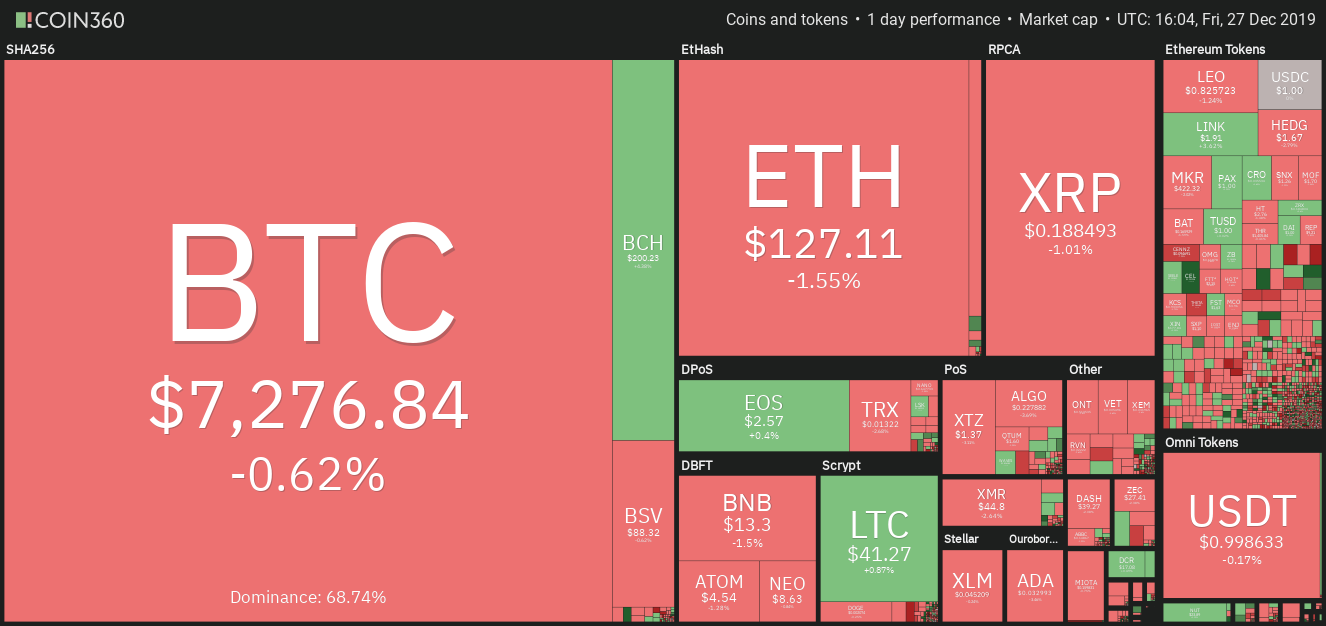
Daily cryptocurrency market performance. Source: Coin360
The central bank of Russia, along with exploring the launch of its own digital currency, has also started testing stablecoins that are pegged to real assets. However, Elvira Nabiullina, Russia’s central bank head, has said that though the bank is studying potential uses of stablecoins, it does not “assume that they will function as a means of payment and become a surrogate for money.”
These developments show that the central banks have started to recognize the advantages of cryptocurrencies but are not willing to accept it openly. However, as cryptocurrencies find greater adoption in the real world, the central banks will be forced to up their game to keep up with the competition. This is likely to prove beneficial for crypto prices. Let’s see if we spot any buying opportunities in the major cryptocurrencies.
BTC/USD
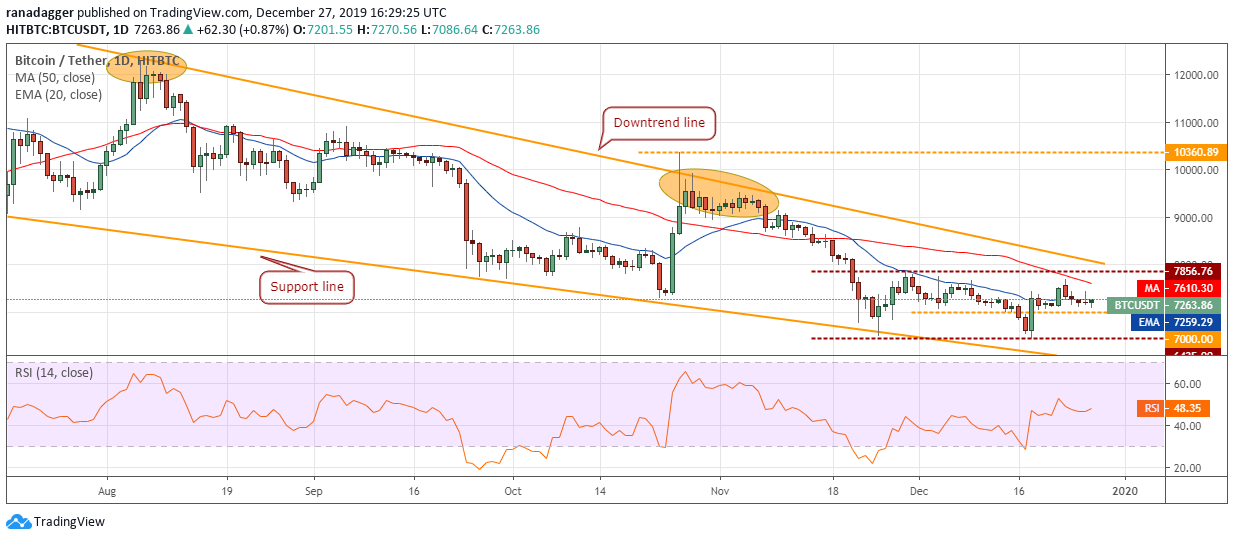
Bitcoin (BTC) has held the first support at $7,000. This is a positive sign as it shows the willingness of the bulls to buy at higher levels rather than wait for more downside. The 20-day EMA is flat and the RSI is close to the midpoint, which suggests that the selling pressure has reduced.
BTC USD daily chart. Source: Tradingview
However, unless the price quickly bounces off the current levels, the bears will resume their efforts to sink the price below $7,000. A break below $7,000 can drag the price to the recent low of $6,435.
Conversely, if the bulls can push the BTC/USD pair above the overhead resistance at $7,856.76, it might start a new up move. Therefore, traders can buy above $7,856.76 as suggested in our earlier analysis. We anticipate the price to take a decisive direction within the next few days.
ETH/USD
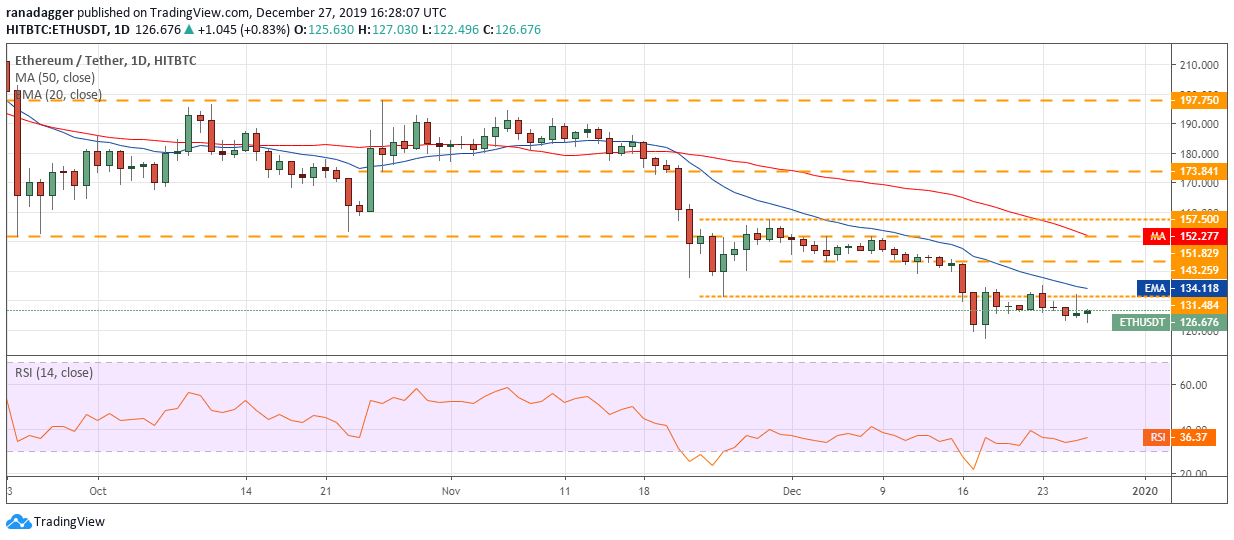
The bears thwarted the attempt by the bulls to push Ether (ETH) above $131.484 on Dec. 26. This shows a lack of demand at higher levels. Both moving averages are sloping down and the RSI is in the negative zone, which suggests that bears are in the driver’s seat.
ETH USD daily chart. Source: Tradingview
The sellers will try to resume the downtrend by breaking below the recent low of $117.09. If successful, a drop to $100 is possible.
However, if the bulls defend the support at $117.09, the ETH/USD pair is likely to remain range-bound for a few days. The first sign of strength will be a break above the 20-day EMA. Until then, we suggest traders remain on the sidelines.
XRP/USD
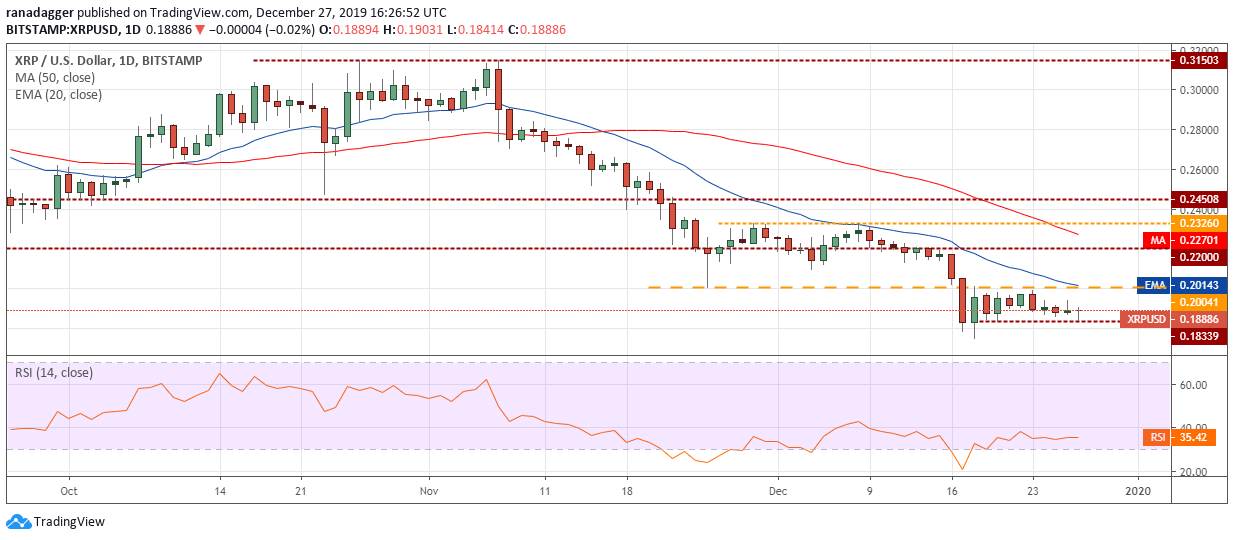
The bulls have managed to keep XRP above the immediate support at $0.18339 for the past few days. This is a minor positive as it shows that the selling pressure has reduced. However, unless the bulls quickly carry the price above 0.20041, the bears might resume their selling and sink the price to the recent low of $0.17468.
XRP USD daily chart. Source: Tradingview
A break below the recent low of $0.17468 will be a huge negative as it can extend the downtrend to $0.15.
Conversely, if the XRP/USD pair rebounds off the current levels or from $0.17468, it might remain range-bound for a few days. We would wait for the pair to breakout and close (UTC time) above $0.20041 before proposing a trade in it.
BCH/USD
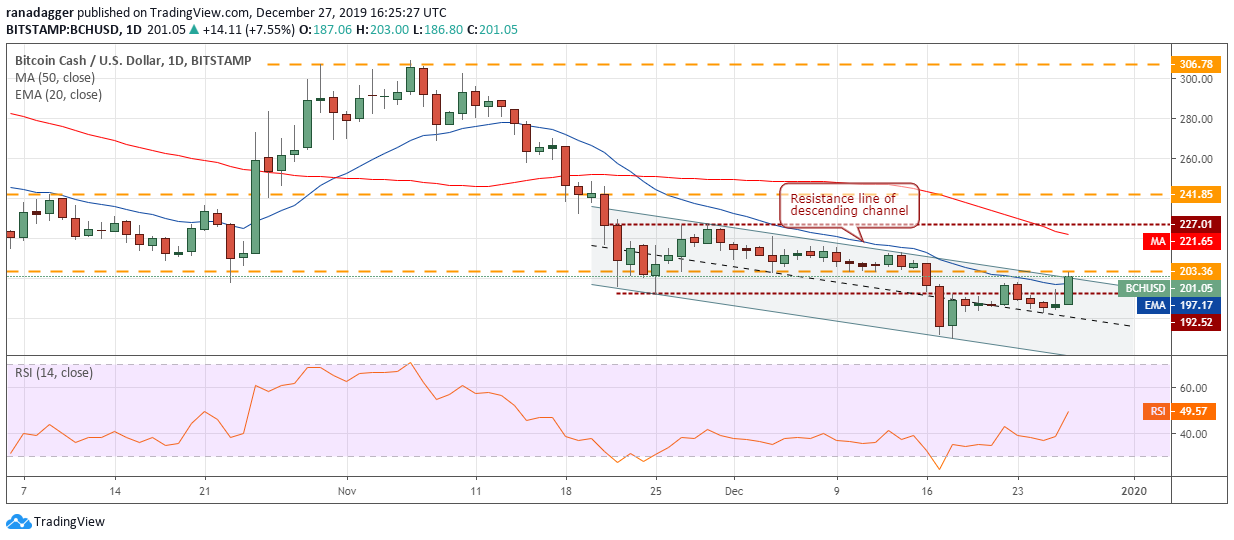
Bitcoin Cash (BCH) has turned around from just below the support at $183.40 on Dec. 25, which is a positive sign. The bulls are now attempting to propel the price above the resistance line of the descending channel. If successful, a move to $227.01 is possible.
BCH USD daily chart. Source: Tradingview
The short-term traders can ride this move higher by buying on a close (UTC time) above $203.36. The stop-loss for the trade can be kept at $181, which can be trailed higher as the price moves up.
However, if the BCH/USD pair fails to break out of the channel, it might again dip back to $183 levels.
LTC/USD
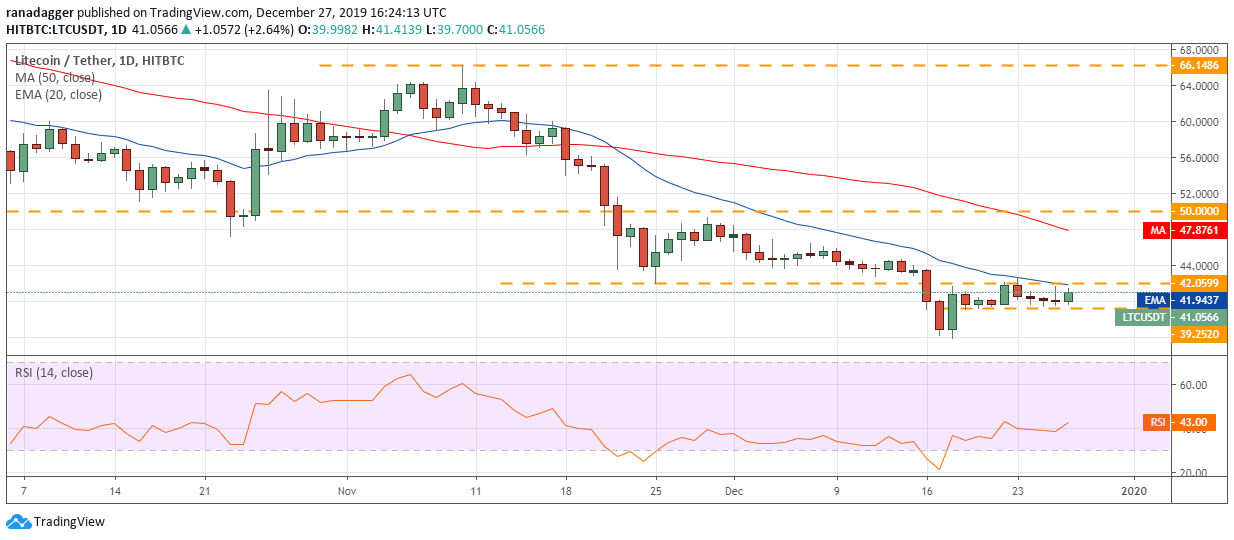
Litecoin (LTC) has been consolidating between $39.252 and $42.0599 for the past few days. Both moving averages are sloping down and the RSI is in the negative territory. This indicates that bears are in command.
LTC USD daily chart. Source: Tradingview
If the LTC/USD pair drops below $39.252, it can slide to $35.8582. Alternatively, if the bulls can push the price above the overhead resistance at $42.0599, it will signal strength.
The short-term traders can wait for a breakout and close (UTC time) above $43 before initiating a long position. The target objective is a move to $50 and the stop-loss can be kept at $38.
EOS/USD
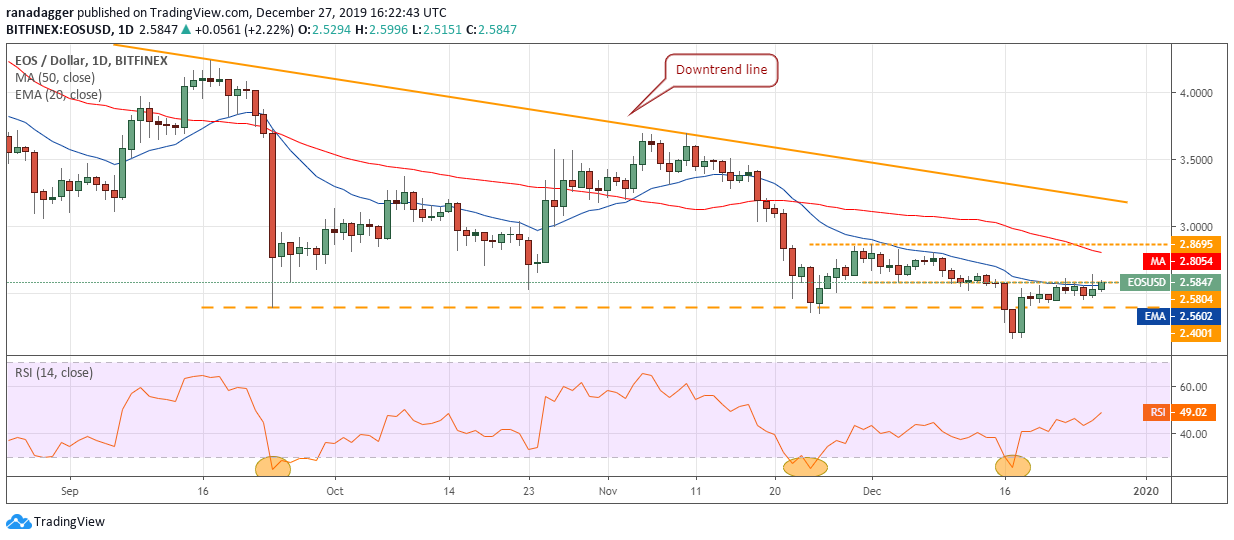
The bulls failed to sustain the move above $2.5804 on Dec. 26. Hence, our buy recommended in an earlier analysis did not trigger. However, the bulls are again attempting to push EOS above the resistance at $2.5804.
EOS USD daily chart. Source: Tradingview
If successful, a move to $2.8695 is possible. Therefore, we retain the buy recommendation given in an earlier analysis.
However, if the bulls again fail to sustain the price above $2.5804, it will indicate a lack of buyers at higher levels. The bears will then attempt to sink the price below $2.4001. If successful, the EOS/USD pair can plummet to the recent low of $2.1624.
BNB/USD
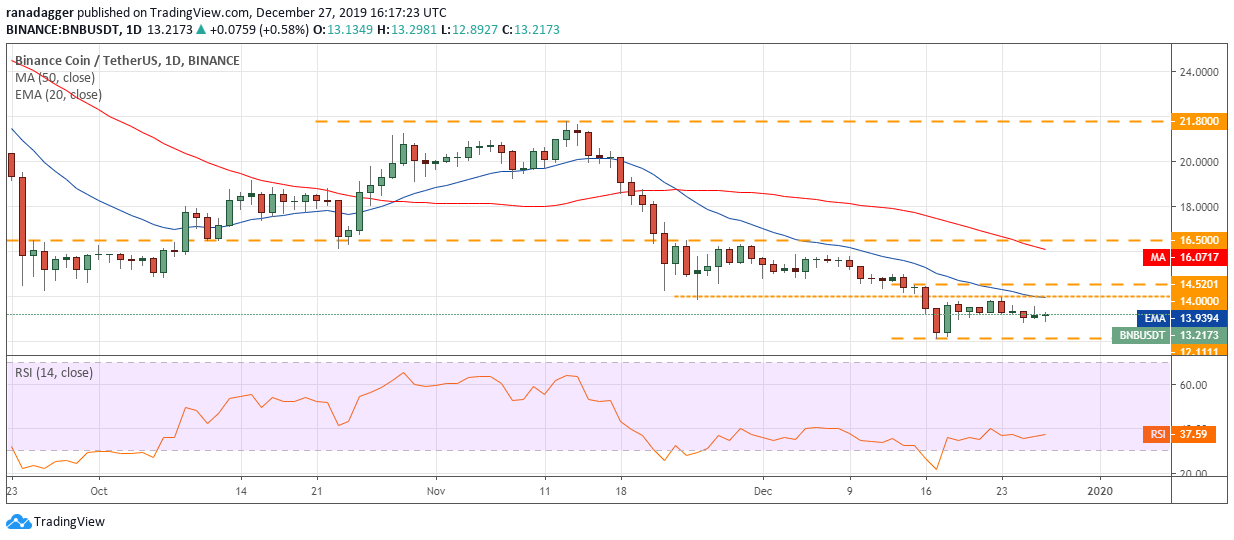
Binance Coin (BNB) continues to trade in the upper-half of $12.1111 to $14 range. Though this is a minor positive, the bulls have failed to propel the price above the overhead resistance. This indicates that buying dries up at higher levels.
BNB USD daily chart. Source: Tradingview
The longer the BNB/USD pair stays inside the range, the stronger will be the eventual breakout or breakdown from it. If the bears sink the price below $12.1111, a drop to $10 is possible.
Alternatively, if the bulls propel the price above $14 to $14.50 resistance zone, a rally to $16.50 is likely. Therefore, traders can buy if the price sustains above $14.50 for four hours. The stop-loss can be kept below the most recent low.
BSV/USD
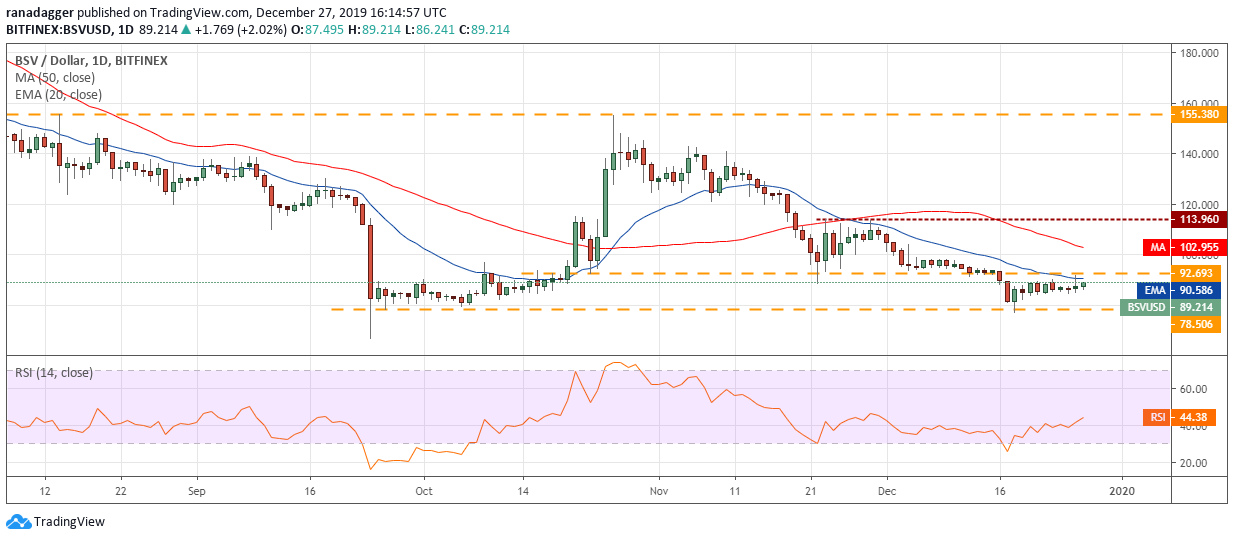
Bitcoin SV (BSV) is stuck inside $78.506 to $92.693 range. Though both moving averages are sloping down and the RSI is in the negative territory, the price has been trading close to the top of the range, which is a positive sign.
BSV USD daily chart. Source: Tradingview
A breakout above $92.693 is likely to attract buying that can push the price to $113.96. Therefore, short-term traders can initiate long positions as recommended in our earlier analysis.
Contrary to our assumption, if the bulls fail to push the price above the range, the bears will try to sink the BSV/USD pair below $78.506. If successful, a drop to $66.666 is possible.
XTZ/USD
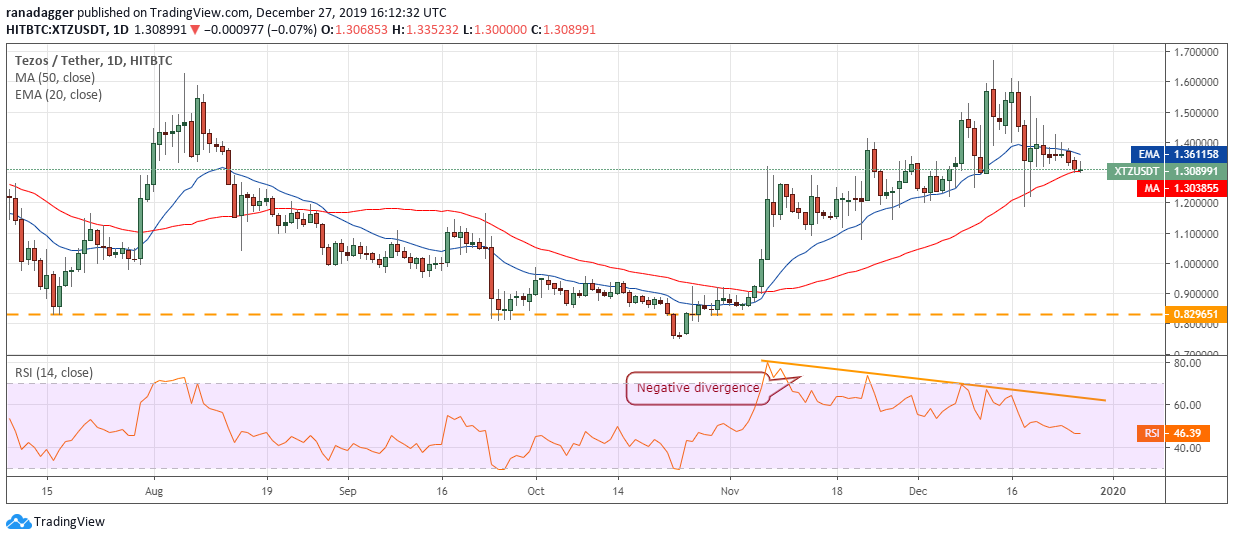
The tight range in Tezos (XTZ) has resolved to the downside. The price is currently at the 50-day SMA, below which a drop to $1.10 is possible. If this support also cracks, the sentiment will turn negative.
XTZ USD daily chart. Source: Tradingview
On the other hand, if the bulls defend the support at the 50-day EMA, the XTZ/USD pair will again attempt to resume the up move. With the 20-day EMA starting to turn down and the RSI dipping into the negative territory, the advantage is with the bears. We suggest traders remain on the sidelines until further clarity emerges.
XLM/USD
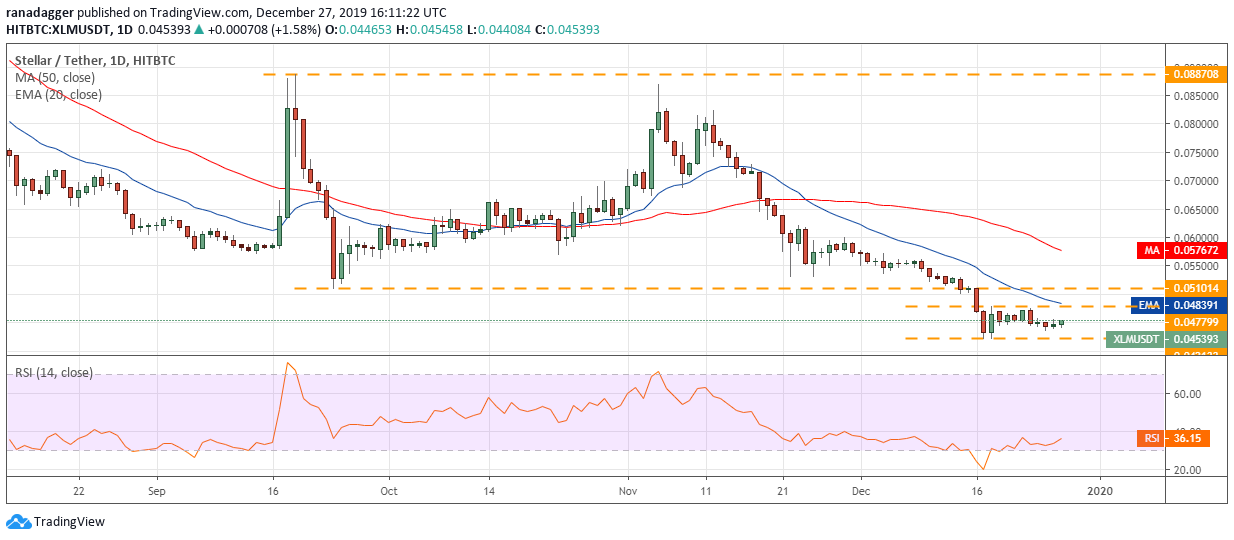
Stellar Lumens (XLM) has again risen into the top ten cryptocurrencies by market capitalization. The price is currently stuck between $0.042133 and $0.047799. Both moving averages are sloping down and the RSI is in the negative zone, which indicates that bears have the upper hand.
XLM USD daily chart. Source: Tradingview
If the bears sink the price below $0.042133, the downtrend will resume. The next support on the downside is $0.036769.
Conversely, if the bulls can push the price above $0.047799, the XLM/USD pair can move up to $0.051014. We will wait for the price to sustain above $0.051014 before turning positive.
The views and opinions expressed here are solely those of the author and do not necessarily reflect the views of CryptoX. Every investment and trading move involves risk. You should conduct your own research when making a decision.
Market data is provided by HitBTC exchange.


