Is the current dip the final buying opportunity before halving boosts Bitcoin price?
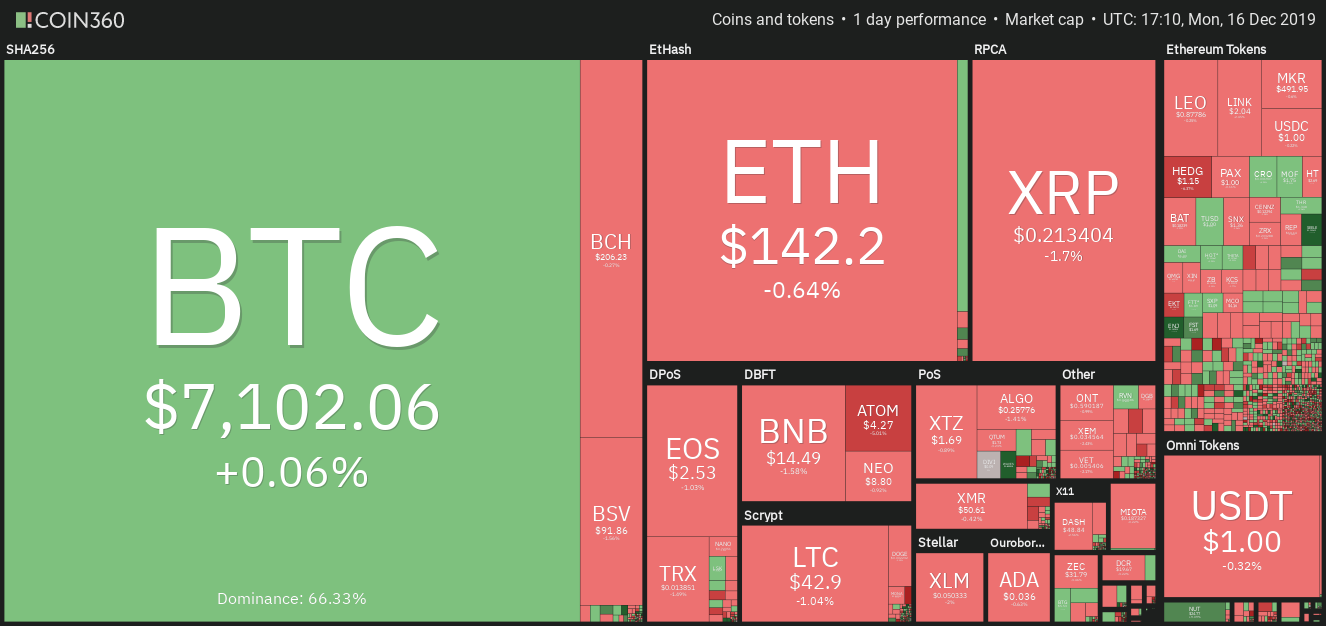
Bitcoin’s market dominance has been holding above 65% mark since late July of this year. This shows that Bitcoin continues to garner the maximum interest from the market participants. There were periods in the past few months when it looked like an “altseason” was around the corner but it never materialized.
Most major cryptocurrencies — led by Bitcoin — topped out in June of this year and have been gradually moving lower since. At the end of the year, in the absence of any major trigger, fresh money is unlikely to enter the space. Most institutional players prefer to park their money in the asset class that is in an uptrend instead of holding on to the losers.
Daily cryptocurrency market performance. Source: Coin360
However, things might change in the new year as institutional investors allocate fresh capital to be invested in various asset classes.
During that period, they are likely to look for assets that show value. Historically, halving has been bullish for Bitcoin. Hence, we anticipate money to flow into this space early next year to benefit from the upcoming halving that is about 150 days away in May.
So, should the retail traders invest at the current levels or wait for a bottom to be confirmed before buying? Let’s study the charts and find levels that will indicate a likely change in the trend.
BTC/USD
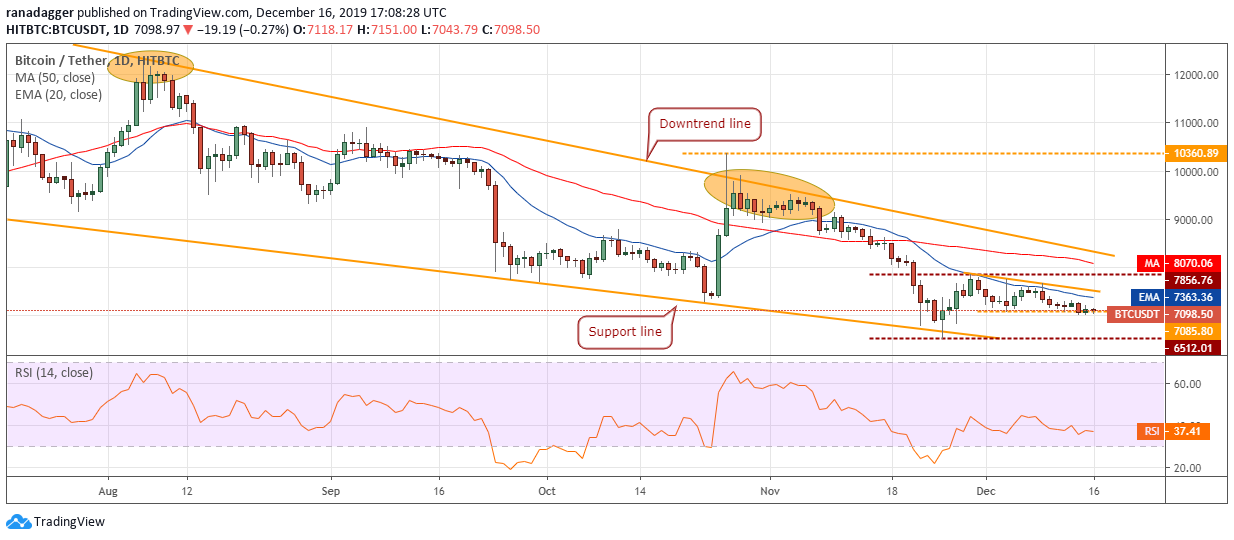
The bulls are struggling to keep Bitcoin (BTC) above the $7,085.80 support. This is a bearish sign as it shows a lack of buyers at current levels. Both moving averages are sloping down and the RSI is in the negative zone, which suggests that bears have the upper hand.
BTC USD daily chart. Source: Tradingview
If the bears sink the price below $7,000, the possibility of a decline to the critical support at $6,512.01 increases. A break below this support will be a huge negative as it will resume the downtrend.
However, if the bulls defend the support at $6,512.01, the BTC/USD pair might remain range-bound between $6,512.01 to $7,856.76 for a few more days. A break above $7,856.76 will be the first sign that demand is picking up.
We anticipate a new uptrend to start on a break above the downtrend line of the wedge. Therefore, traders can initiate long positions as suggested in our earlier analysis.
ETH/USD
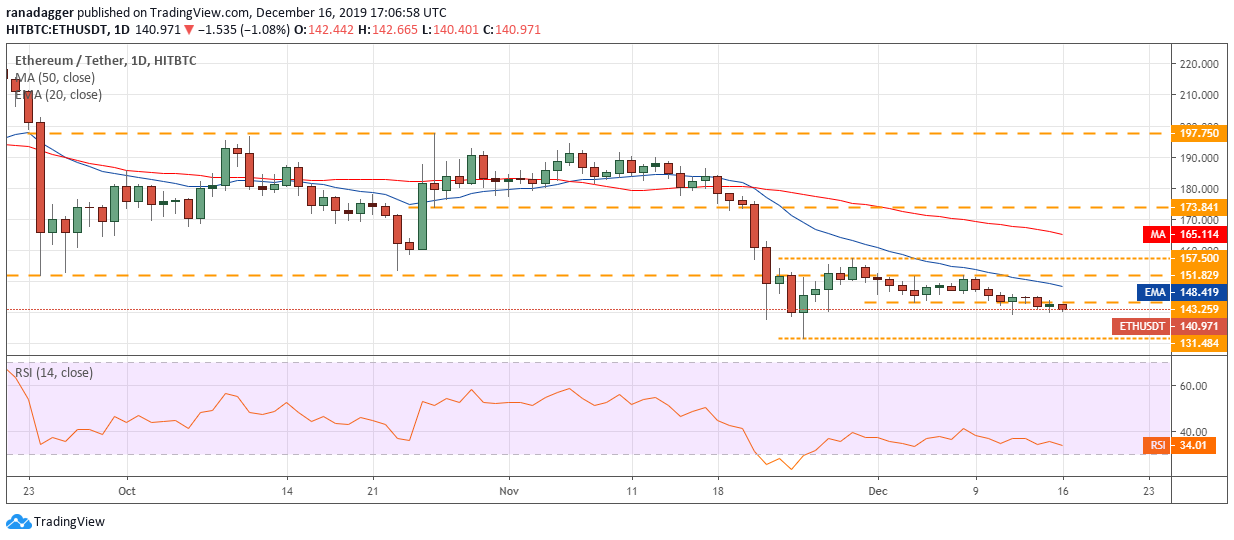
The bulls could not capitalize on the recovery from the lows on Dec. 12, which is a negative sign. It shows a lack of buyers at higher levels. The bears have once again broken below the support at $143.259 and Ether (ETH) is likely to dip to the next support at $131.484.
ETH USD daily chart. Source: Tradingview
The downsloping moving averages and the RSI close to the oversold zone show that bears have the upper hand. A break below $131.484 will be a huge negative as it will resume the downtrend.
Conversely, if the ETH/USD pair turns around from the current levels or from $131.484 and rises above the $157.50, it will indicate strength. Until then, we suggest traders remain on the sidelines.
XRP/USD
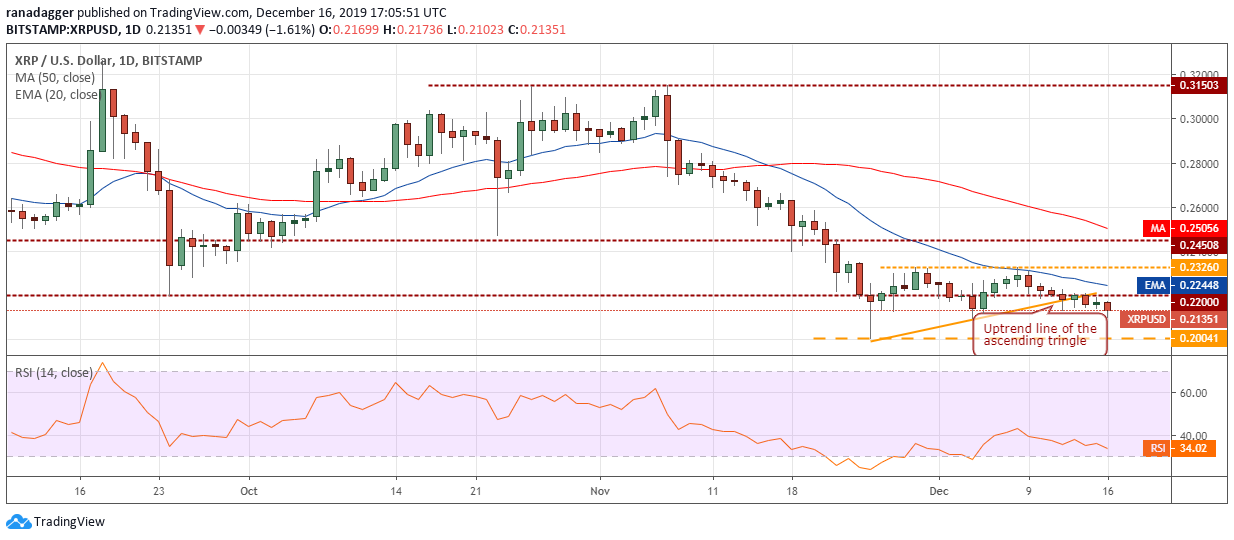
The failure of the bulls to propel the price above $0.22 on Dec. 14 attracted sellers. XRP has resumed its down move to the next support at $0.20041. Both moving averages are sloping down and the RSI is close to the oversold zone, which suggests bears have the advantage.
XRP USD daily chart. Source: Tradingview
If the bears sink the price below $0.20041, the downtrend will resume. The next support on the downside is $0.18.
Our bearish view will be negated if the XRP/USD pair bounces off $0.20041 and rises above the 20-day EMA. This will indicate value buying at lower levels. We will turn positive on a break above $0.2326.
BCH/USD
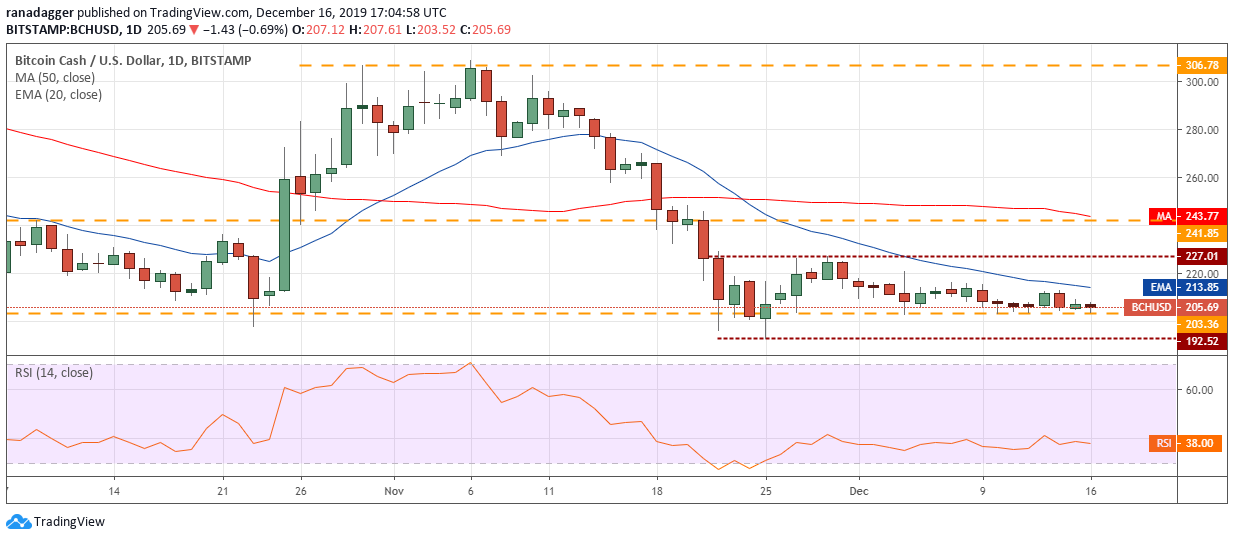
Bitcoin Cash (BCH) turned down from just under the 20-day EMA on Dec. 14. The bulls are once again attempting to defend the support at $203.36. However, retests of the support level are weakening it. Therefore, we anticipate a move down to $192.52.
BCH USD daily chart. Source: Tradingview
If the bears sink the price below $192.52, the downtrend will resume. The next support on the downside is much lower at $166.98.
However, if the bulls defend the support at $192.52, the BCH/USD pair might remain range-bound between $192.52 and $227.01 for a few more days. We will turn positive on a breakout of $227.01. Until then, we remain neutral on the pair.
LTC/USD
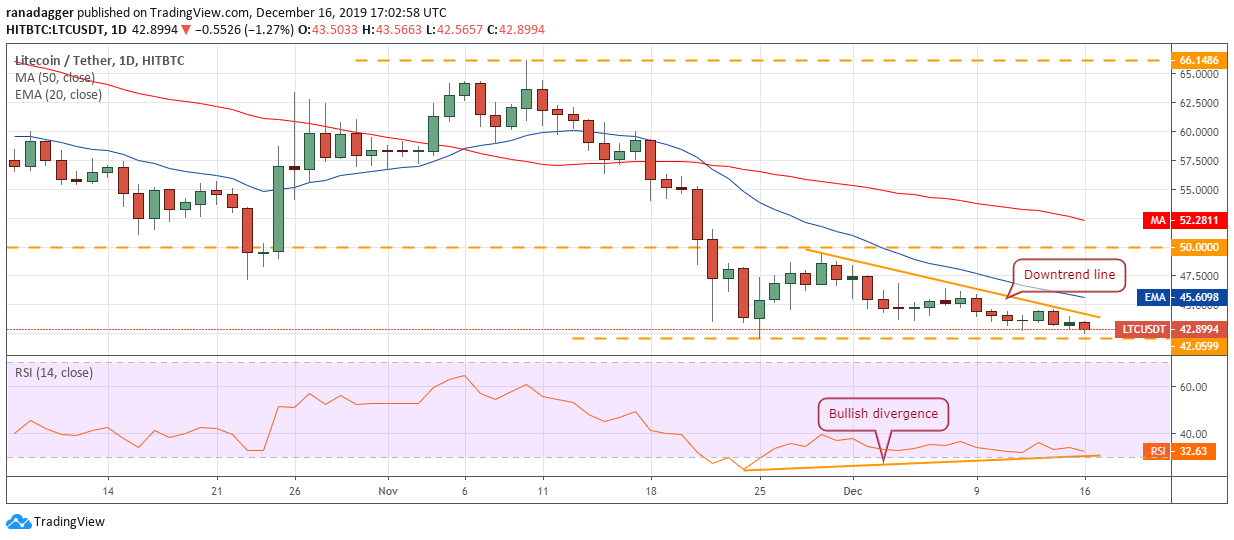
Litecoin (LTC) turned down from the downtrend line on Dec. 14 and again dipped to the support at $42.0599. The bears will now attempt to sink the price below this level. If successful, the downtrend will resume. The next support on the downside is $36.
LTC USD daily chart. Source: Tradingview
A bullish divergence is forming on the RSI but it can be considered as a valid buy signal only after the price starts to move up.
If the LTC/USD pair bounces off the current level and rises above the 20-day EMA, it can move up to $50. A breakout of $50 will signal a likely bottom and can offer a buying opportunity.
EOS/USD
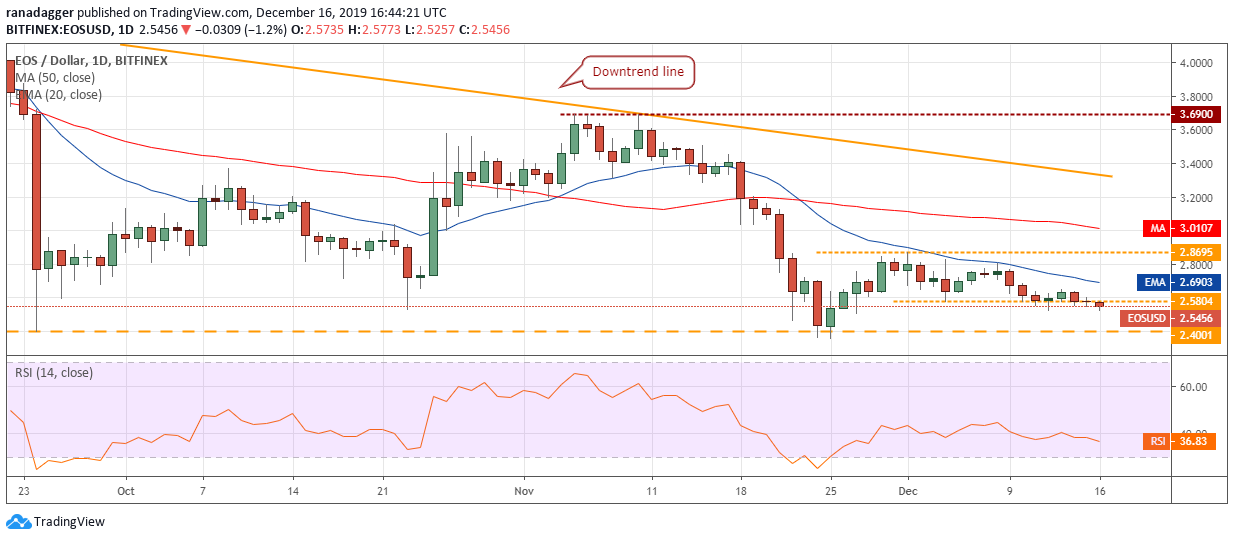
The recovery above $2.5804 on Dec. 13 was short-lived. The price once again turned down below $2.5804 on Dec. 14. This shows that the sentiment is to sell the minor rallies. EOS can now drop to the next support at $2.4001.
EOS USD daily chart. Source: Tradingview
A bounce off $2.4001 can carry the price to $2.5804. Above this, a move to $2.8695 is possible. We will watch the price action at $2.4001 before recommending a long position in it.
If the bears sink the EOS/USD pair below $2.4001, the downtrend will resume. The next support on the downside is $2.2 and below it $1.55.
BNB/USD
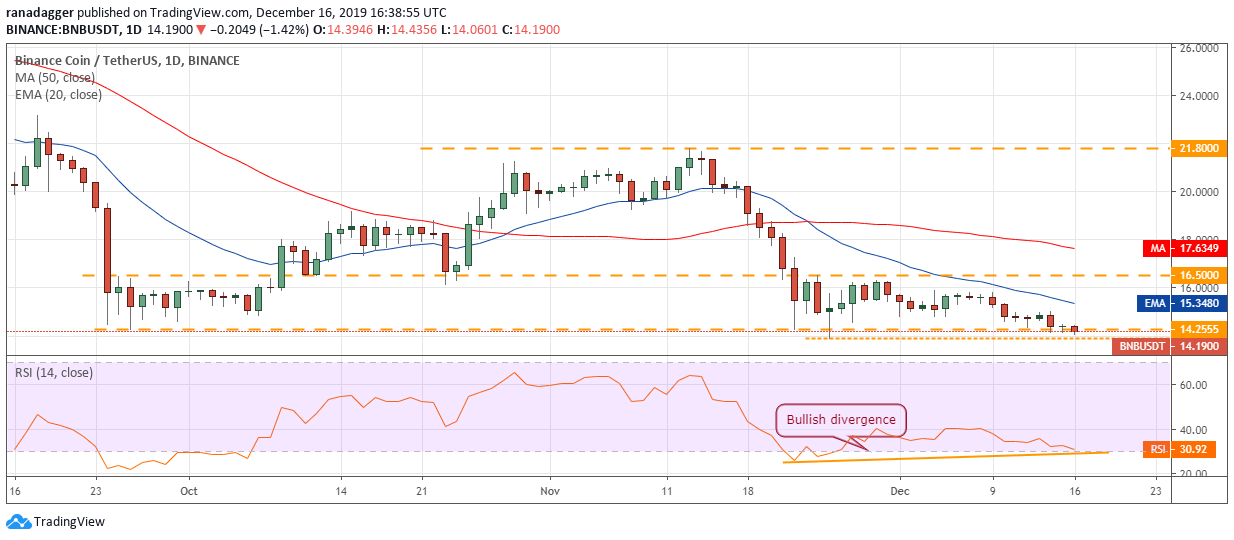
Binance Coin (BNB) has broken below the support at $14.2555. There is minor support at $13.88 from where the price had bounced on Nov. 25. But if this level also cracks, a decline to $11.30 could occur.
BNB USD daily chart. Source: Tradingview
The downsloping moving averages and the RSI close to oversold territory indicate that bears have the upper hand.
Our bearish view will be invalidated if the BNB/USD pair rebounds off the current level and rallies above $16.50. Such a move will signal accumulation on dips and might offer a buying opportunity. The traders can initiate long positions above $16.50, as suggested in our earlier analysis.
BSV/USD
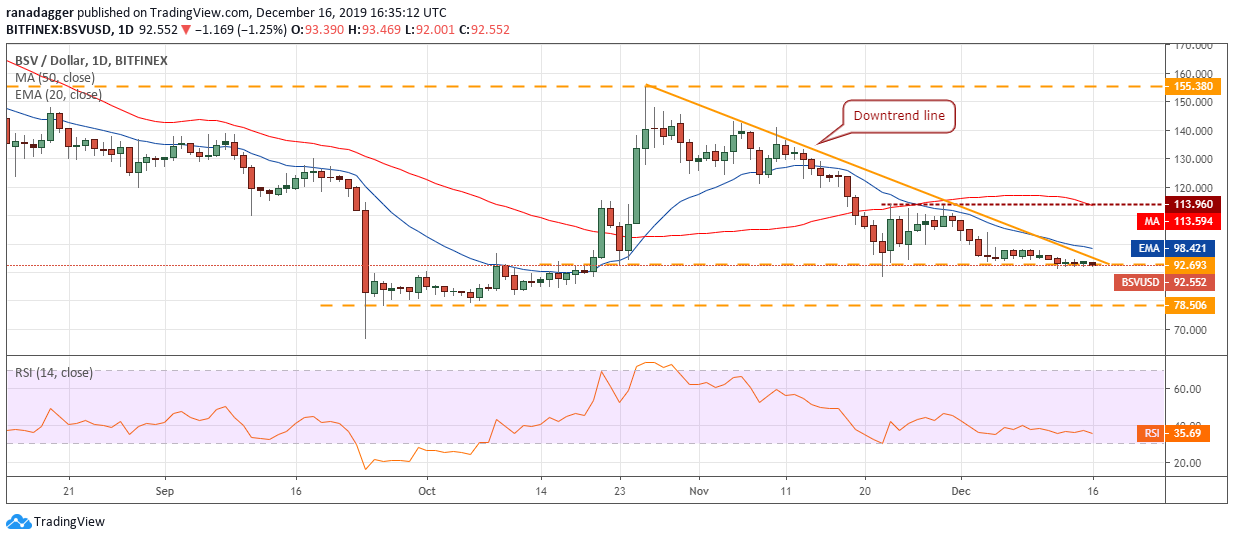
Bitcoin SV (BSV) has been trading close to $92.693 for the past four days. This shows a lack of urgency among the bulls to buy at these levels. With no buying support, the bears will try to sink the price to $78.506.
BSV USD daily chart. Source: Tradingview
Contrary to our assumption, if the price rebounds off the current levels and breaks out of the 20-day EMA, a move to $113.96 is possible. This is an important level to watch out for because if the bulls can scale above it, a rally to $155.38 is likely.
However, if the BSV/USD pair turns down from $113.96, it might remain range-bound for a few days. We will wait for the buyers to assert their supremacy before recommending to trade the pair.
XTZ/USD
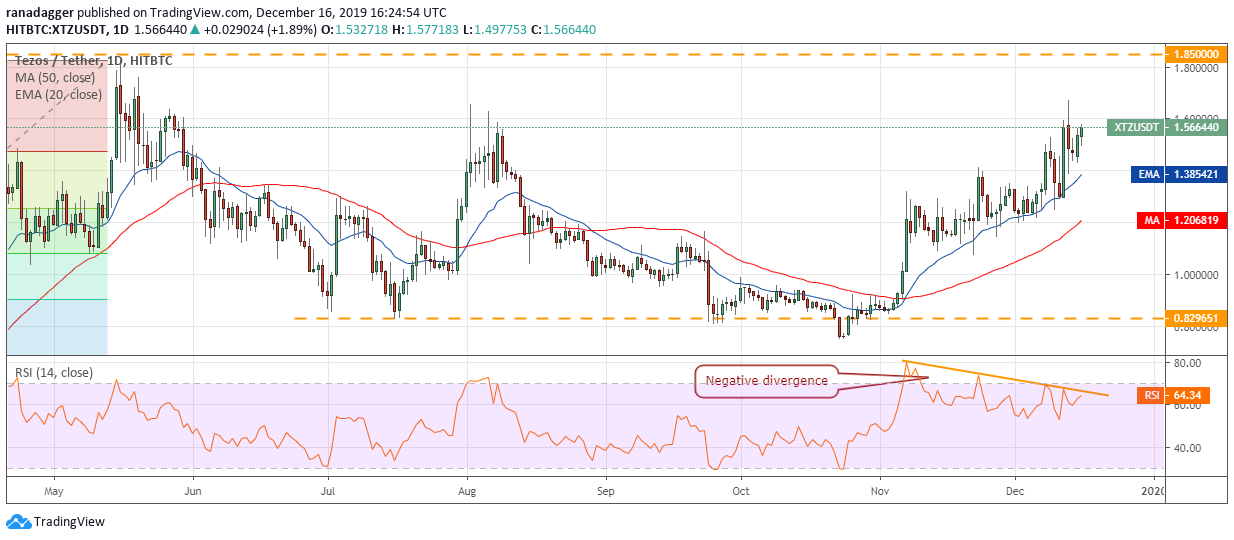
Tezos (XTZ) turned down from just above $1.65 level on Dec. 13. But the positive thing is that the bulls did not wait for the price to dip to the 20-day EMA to buy. This shows that every minor dip is being purchased. The bulls will once again try to scale above $1.65.
XTZ USD daily chart. Source: Tradingview
If successful, a rally to $1.85 is possible where we anticipate the bulls to again face stiff resistance. The XTZ/USD pair will pick up momentum on a close (UTC time) above $1.85.
While most of the indications on the chart are positive, the developing negative divergence on the RSI warrants caution. If the bulls again fail to propel the price above $1.65, the possibility of a drop to the 20-day EMA and below it to the 50-day SMA increase. We remain positive but will wait for a reliable buy setup to form before suggesting a trade in it.
XLM/USD
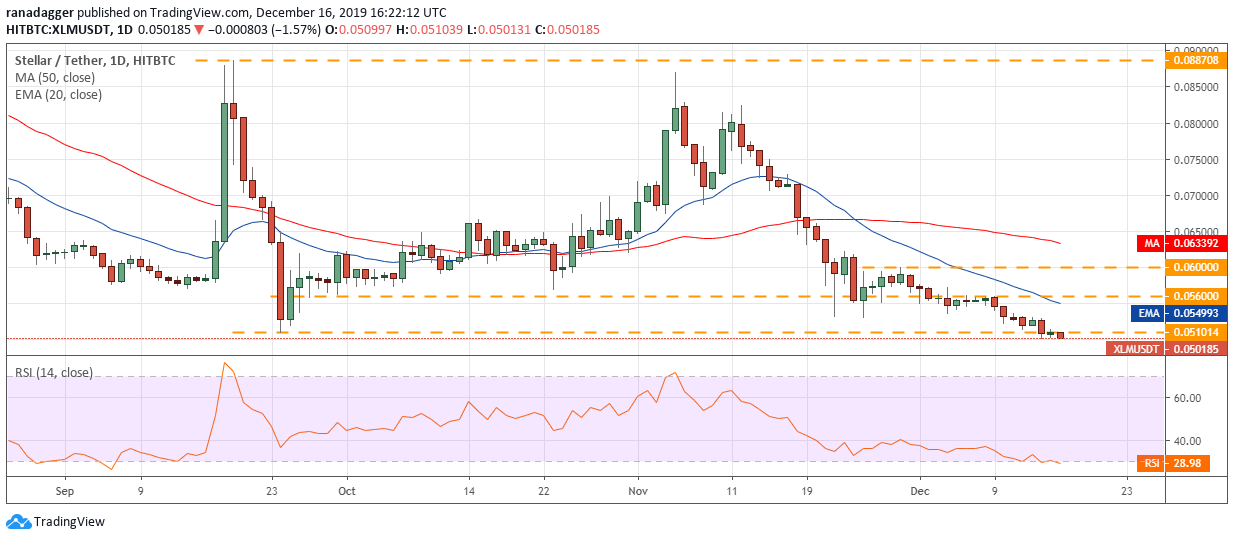
Stellar (XLM) has broken below the critical support at $0.051014. Moreover, the bulls could not even manage a minor bounce off this level, which shows a lack of demand even at these levels. Both moving averages are sloping down and the RSI is in oversold territory, which shows that bears are in command.
XLM USD daily chart. Source: Tradingview
Unless the price turns around from the current levels and sustains above $0.051014, the downtrend will continue. The next support on the downside is $0.041748.
Conversely, if the XLM/USD pair reverses direction and breaks out of the 20-day EMA, it will be a sign of strength. However, as the pair has made a new yearly low, we withdraw our earlier buy recommendation. We would now wait for a reversal pattern to form before considering it a buy.
The views and opinions expressed here are solely those of the author and do not necessarily reflect the views of CryptoX. Every investment and trading move involves risk. You should conduct your own research when making a decision.
Market data is provided by HitBTC exchange.


