

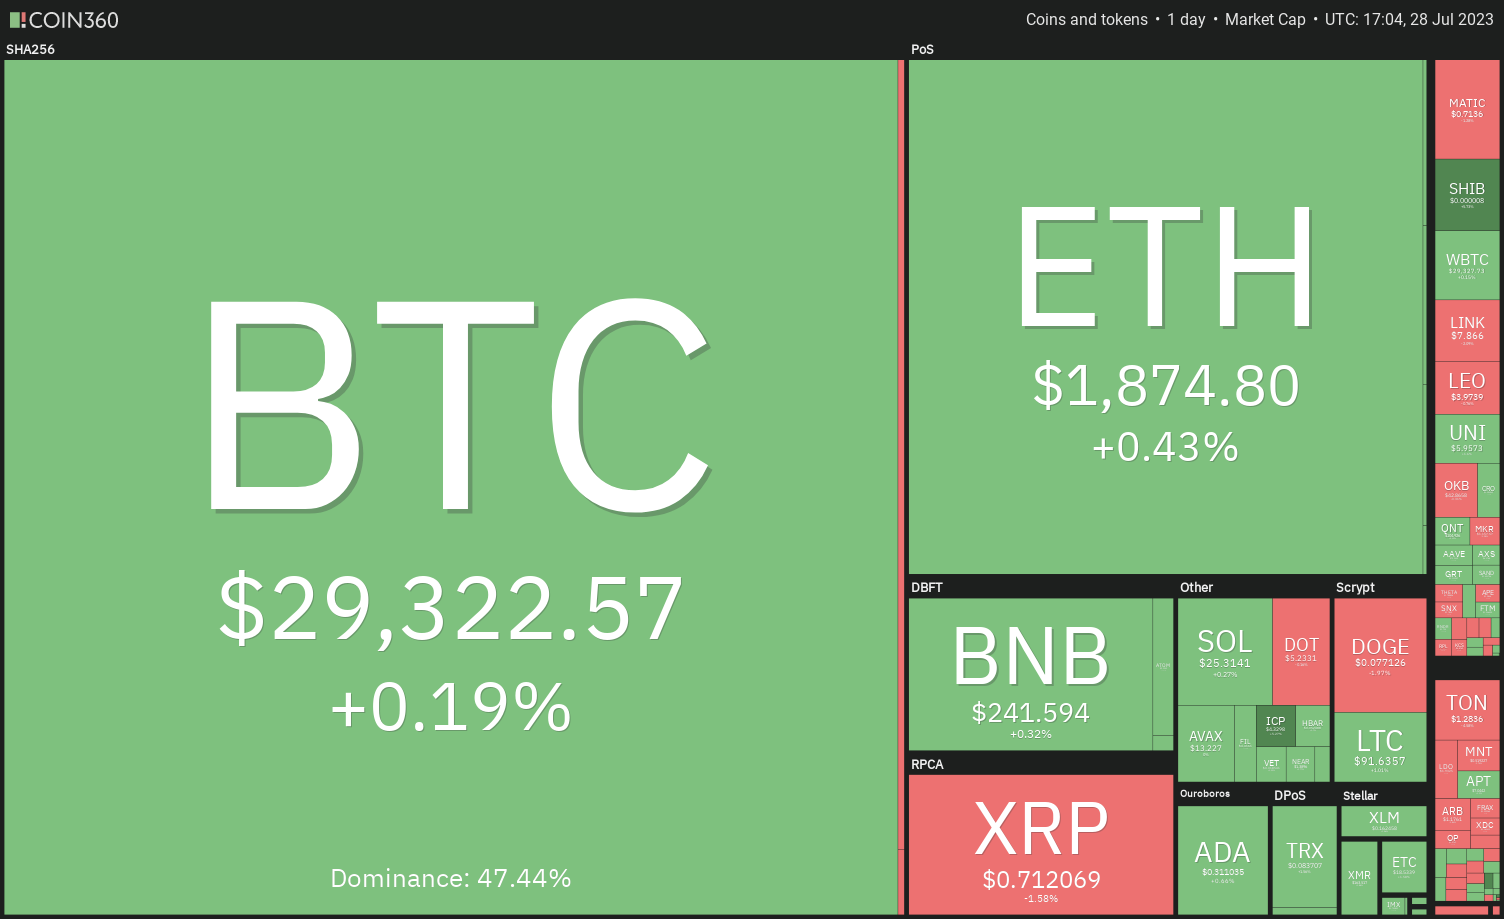
Bitcoin’s price action remains lackluster, but select altcoins are showing signs of breaking out of their respective resistance levels.
The 25 basis point rate hike by the Federal Reserve on July 26 and the subsequent commentary by Fed Chair Jerome Powell failed to catapult Bitcoin (BTC) out of its range. This suggests that the event did not have any surprises and the outcome was already priced in by the markets.
The crypto markets continued their lackluster performance on July 28 after the United States Personal Consumption Expenditures (PCE) Index print came in lower than analysts’ expectations. The PCE is the Fed’s preferred inflation metric; hence, it is watched closely by market observers.
Although the near-term price action has kept the traders guessing, it is important to keep an eye on the long-term crypto story. Standard Chartered head of crypto research Geoff Kendrick said while speaking with CNBC that he expects Bitcoin to end 2024 in the range of $100,000 to $120,000. He believes that Bitcoin is likely to witness price patterns seen during previous halving cycles.
Even as Bitcoin consolidates, could select altcoins break out of their slumber?
Let’s study the charts of the top-10 cryptocurrencies to find out.
Bitcoin price analysis
Bitcoin’s bounce off the 50-day simple moving average ($29,250) is fizzling out near the 20-day exponential moving average ($29,743), indicating that higher levels are attracting sellers.
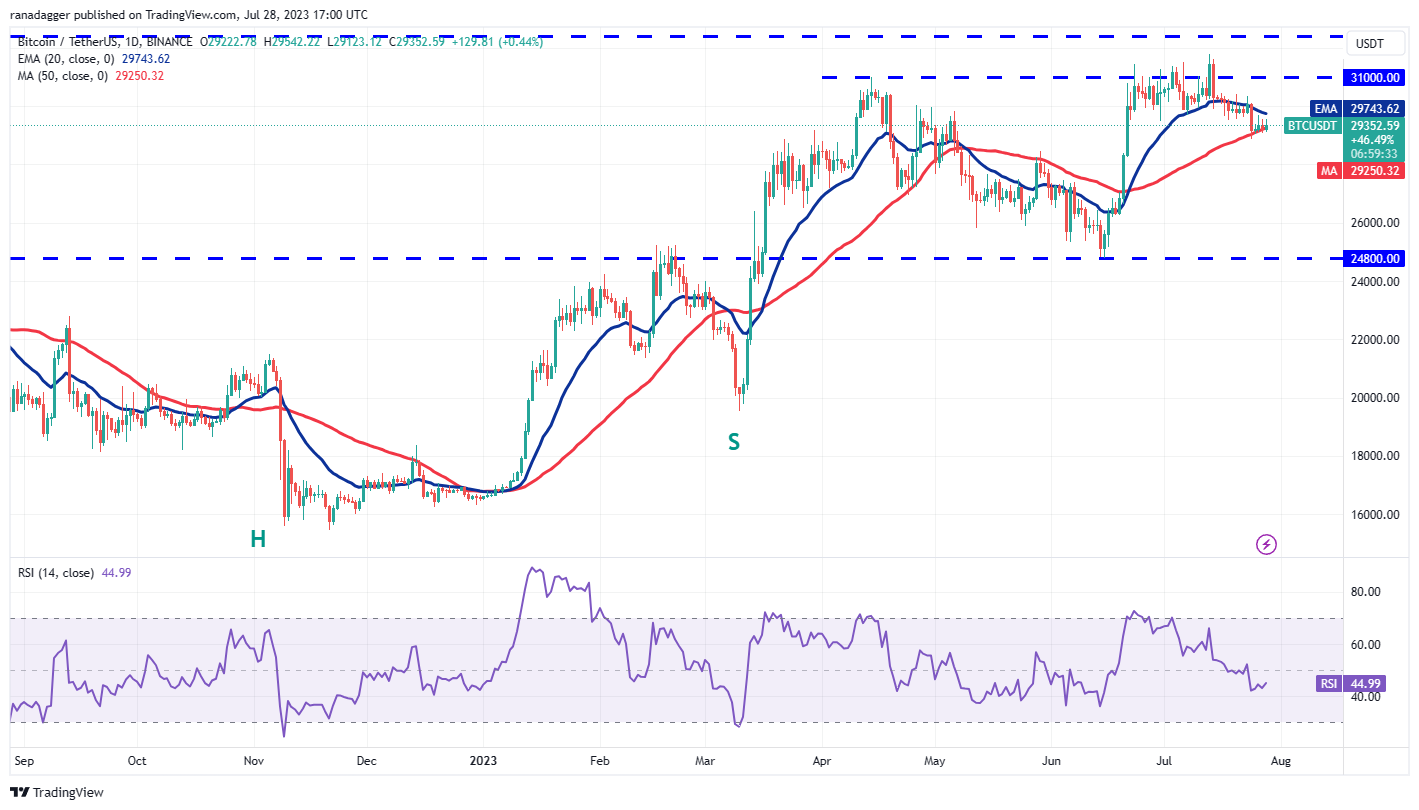
The 20-day EMA has started to turn down, and the relative strength index (RSI) is in the negative territory, indicating that bears have a slight edge.
If bears sink the price below the immediate support at $28,861, the BTC/USDT pair may start a downward move to $27,500 and then to $26,000. Such a move will suggest that the pair may extend its stay inside the $24,800-to-$31,000 zone for some time.
The important level to watch on the upside is the 20-day EMA. If this resistance is scaled, the pair may rise toward $31,000. The bears are likely to face an acid test in the $31,000-to-$32,400 region.
Ether price analysis
Ether (ETH) has been stuck between the moving averages for the past few days. This shows that the bulls are buying the dips to the 50-day SMA ($1,854), but they haven’t been able to kick the price above the 20-day EMA ($1,881).

This narrow-range trading is unlikely to continue for long and it may soon resolve with a strong breakout. If the bulls shove the price above the 20-day EMA, the ETH/USDT pair may rise to $1,930 and, eventually, to $2,000.
Conversely, if the price turns down and plunges below the 50-day SMA, it will suggest that the bears have the upper hand. The pair may then oscillate inside the large range between $1,626 and $2,000 for a while longer.
XRP price analysis
After the sharp rally on July 13, XRP (XRP) may enter a period of consolidation. The boundaries of this range could be $0.67 and $0.85.
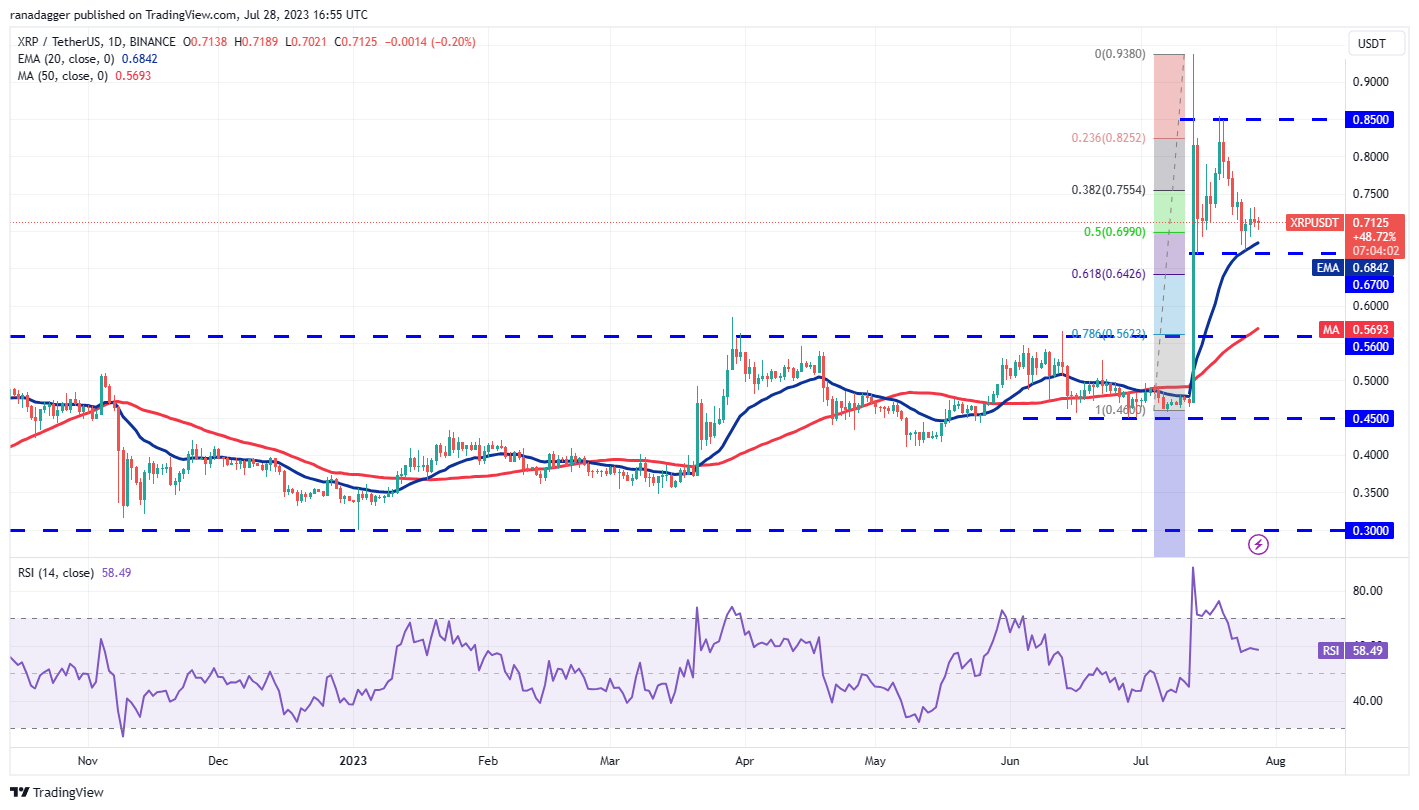
The 20-day EMA ($0.68) is sloping up gradually and the RSI is in the positive territory, indicating that the bulls have a slight edge. The XRP/USDT pair could rise to $0.75 and if this level is surmounted, the rally could continue to $0.85.
On the contrary, if the price turns down and plunges below $0.67, it will suggest that bears have seized control. The pair could then nosedive to the breakout level of $0.56. This level is likely to attract buyers.
BNB price analysis
BNB’s (BNB) price action has been random and volatile inside the triangle as both the bulls and the bears battle it out for supremacy.
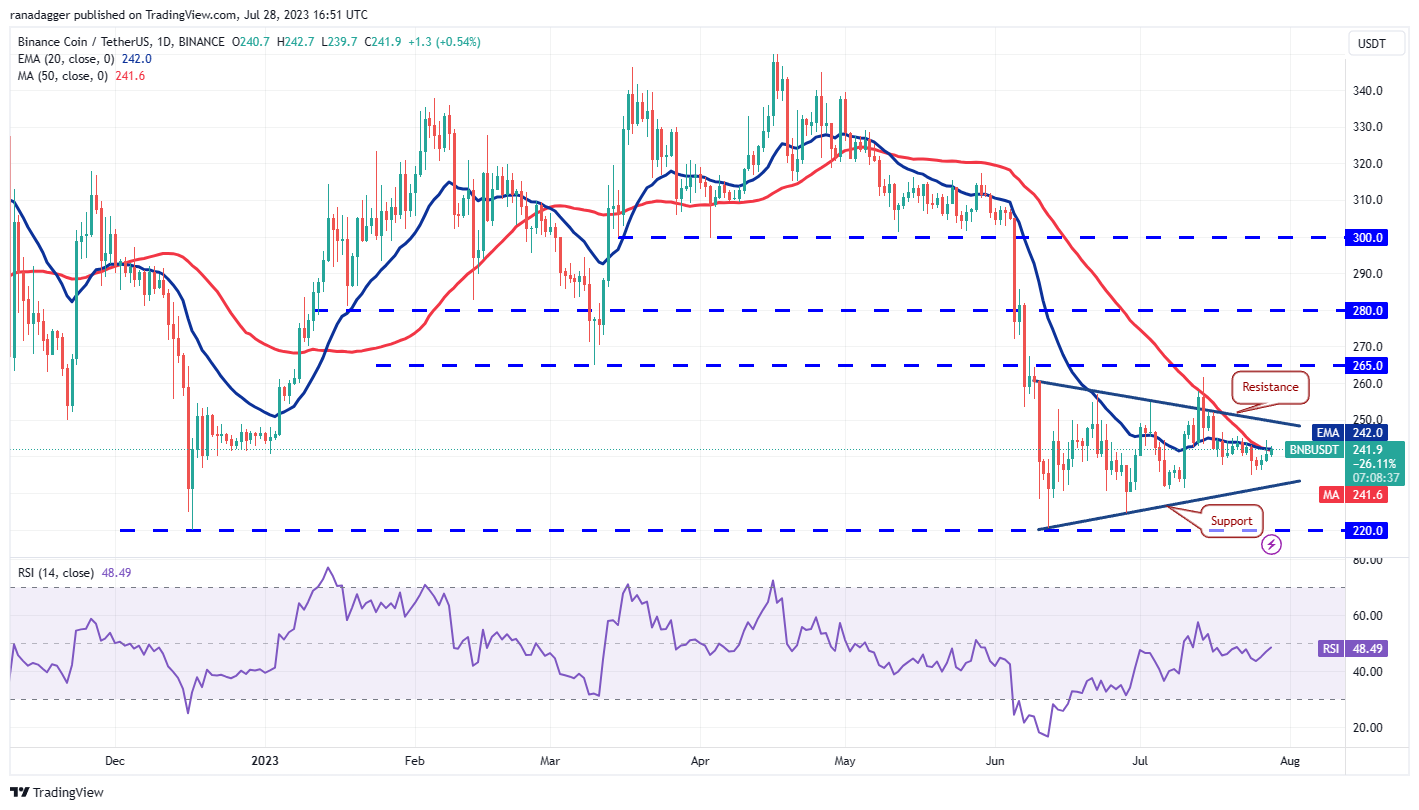
If buyers push the price above the moving averages, the BNB/USDT pair could rise to the resistance line of the triangle. This is an important level for the bears to defend because a break above it could propel the price to $265 and then to the pattern target of $290.
Instead, if the price turns down from the current level, it will suggest that bears are maintaining their selling pressure. The pair could then drop to the support line. This level may attract buyers, but if they fail to achieve a meaningful bounce, the pair may decline further and retest the vital support at $220.
Cardano price analysis
Cardano (ADA) rebounded off the breakout level of $0.30 on July 26, indicating that the bulls are trying to defend the support with vigor.
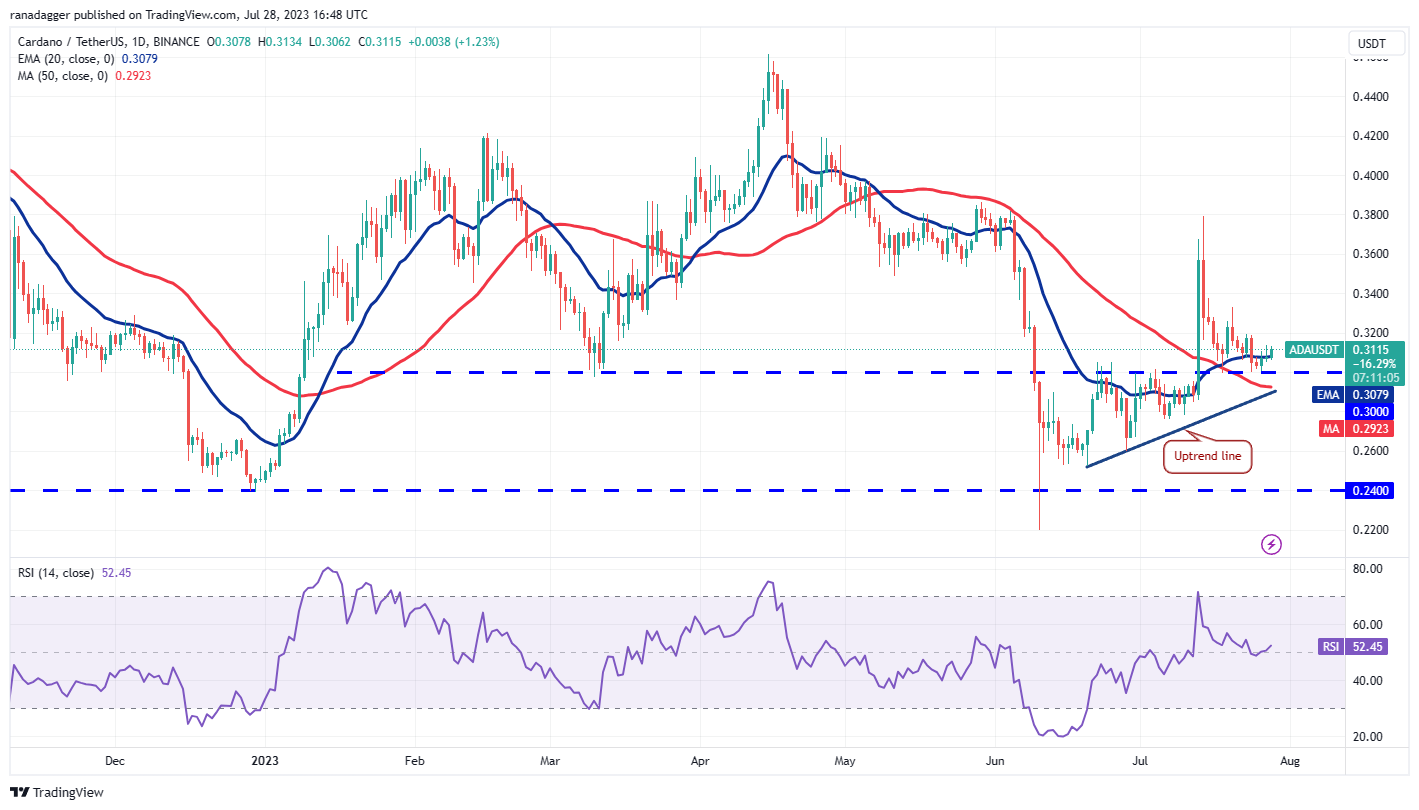
The flattish 20-day EMA ($0.30) and the RSI near the midpoint do not give a clear advantage to either the bulls or the bears. If bulls sustain the price above the 20-day EMA, the ADA/USDT pair could rise to the overhead resistance at $0.34. This level may act as a strong barrier, but if crossed, the ADA/USDT pair could reach $0.38.
If bears want to prevent the up-move, they will have to quickly pull the price below the uptrend line. If they manage to do that, the pair may skid to $0.27 and then to $0.26.
Solana price analysis
Solana (SOL) bounced off the support at $22.30 on July 25 and climbed above the 20-day EMA ($24.07) on July 26, indicating that the range-bound action remains intact.
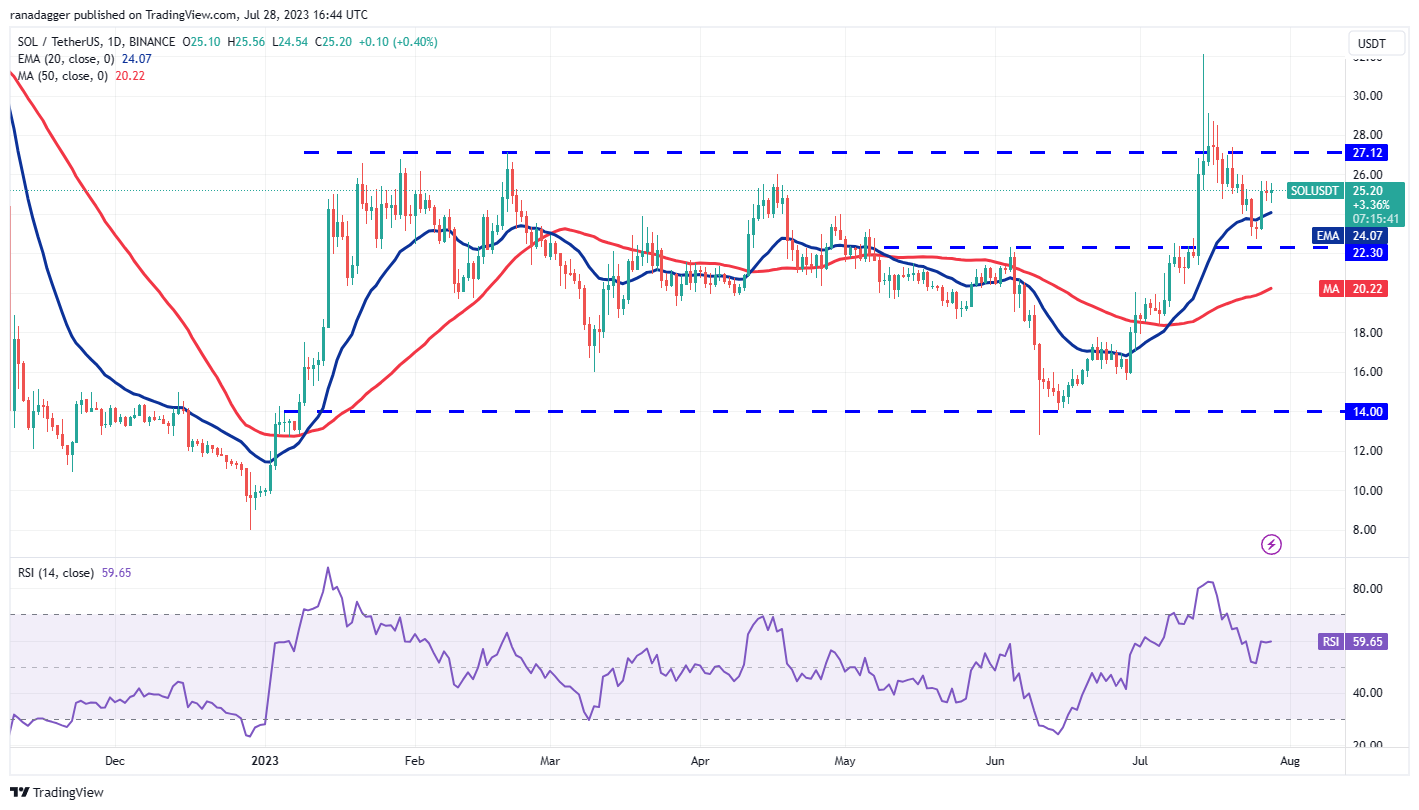
The rising 20-day EMA and the RSI in the positive territory indicate advantage to the buyers. If the price turns up from the current level, the bulls will try to push the SOL/USDT pair to the overhead resistance at $27.12. A break and close above this obstacle may indicate the start of a new uptrend.
On the other contrary, a break below the 20-day EMA could pull the price to the important support at $22.30. This is an important level to watch out for because if it cracks, the pair could slump to the 50-day SMA ($20.22).
Dogecoin price analysis
Dogecoin (DOGE) rose above the overhead resistance of $0.80 on July 25, but the bulls could not sustain the momentum. This shows selling at higher levels.
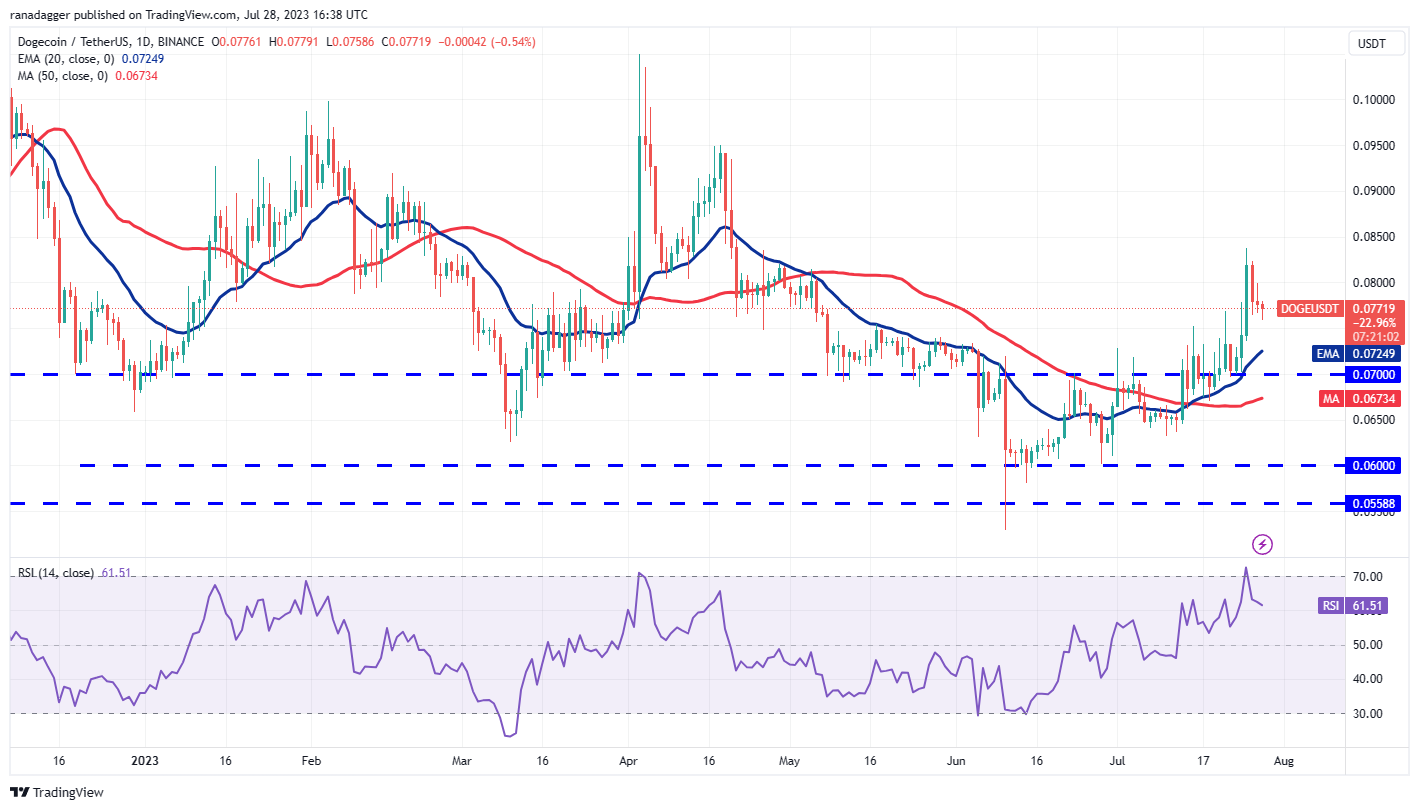
The bears pulled the price back below the breakout level of $0.08 on July 26. The DOGE/USDT pair could slide to the 20-day EMA ($0.07), which is an important level to watch for in the near term.
If the price rebounds off the 20-day EMA, it will suggest that the sentiment has turned positive and traders are buying on dips. That will increase the likelihood of a break above $0.08. If that happens, the pair may soar toward $0.10. This positive view will be negated if the price continues lower and tumbles below $0.07.
Related: French privacy watchdog questions Worldcoin’s data collection method: Report
Polygon price analysis
Polygon (MATIC) has been trading between the moving averages for the past three days, suggesting a state of indecision between the bulls and the bears.
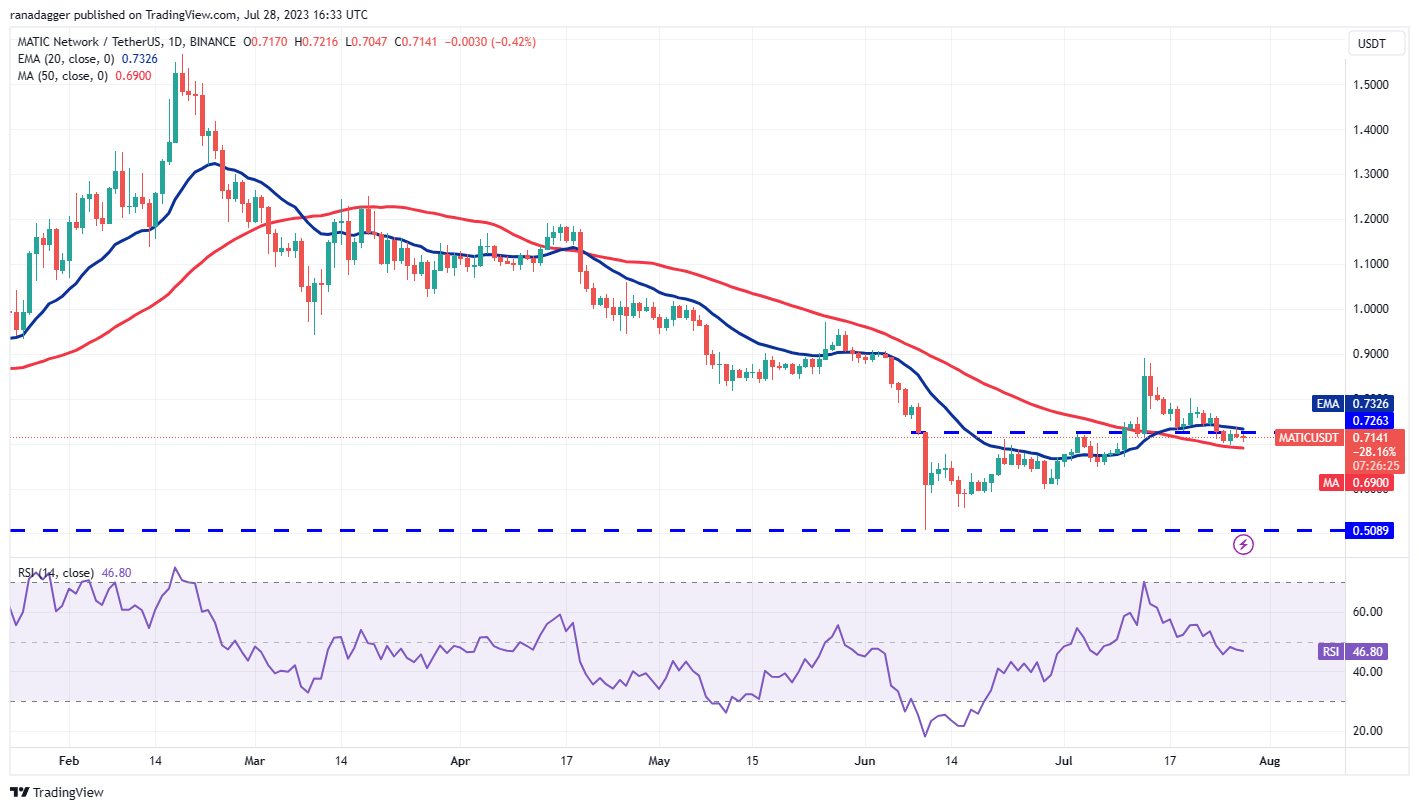
If the price cracks below the 50-day SMA ($0.69), it will suggest that the bears are back in the driver’s seat. The MATIC/USDT pair could then descend to $0.65 and later to the strong support at $0.60.
Contrarily, if the price turns up and breaks above the 20-day EMA, it will suggest that the bulls have overpowered the bears. That could start a recovery to $0.80 and, subsequently, to $0.90.
Litecoin price analysis
Litecoin (LTC) is attempting a recovery, but the bulls are facing stiff resistance at the 20-day EMA ($92). This suggests that the bears are active at higher levels.
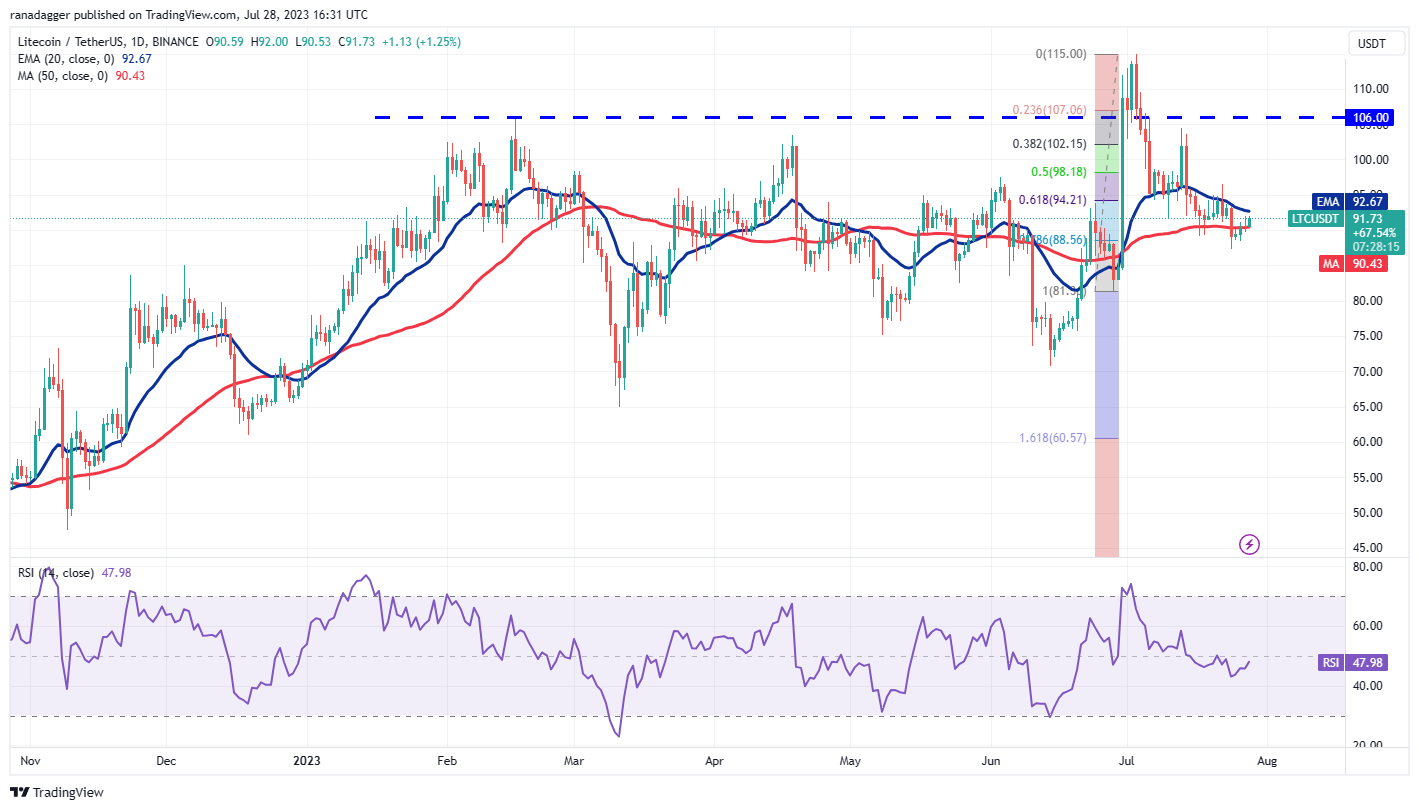
If the price turns down from the 20-day EMA and drops below $87, it will indicate the resumption of the down move. The LTC/USDT pair could then fall to $81, where the bulls may try to arrest the decline.
Alternatively, if bulls drive the price above the 20-day EMA, it will suggest that the selling pressure could be reducing. There is a minor resistance at $96, but if bulls overcome it, the pair may rally toward $106.
Polkadot price analysis
The bulls repeatedly failed to propel Polkadot (DOT) above the 20-day EMA ($5.24) in the past three days, indicating that the bears are selling on minor rallies.
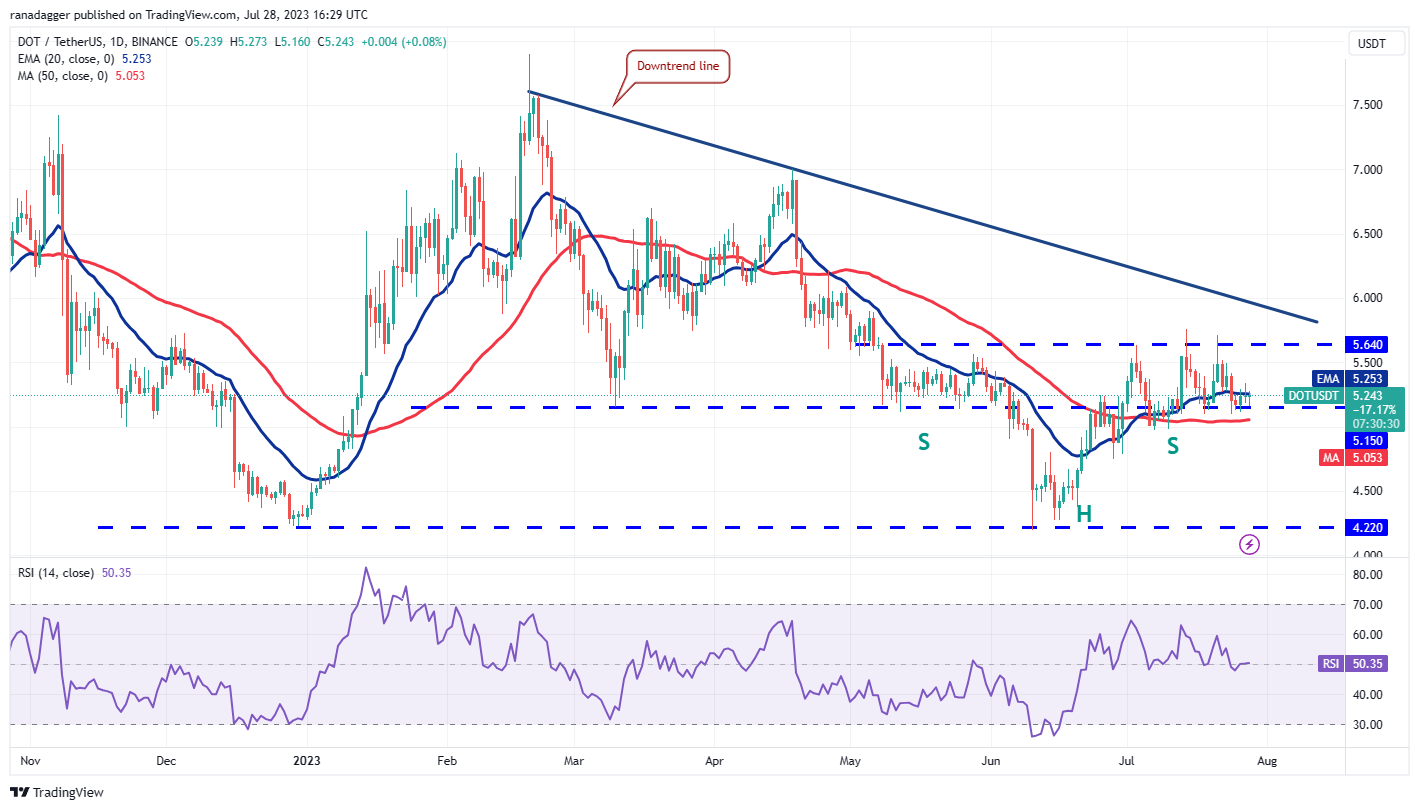
The bears will try to strengthen their position further by pulling the price below the 50-day SMA ($5.05). If they manage to do that, the DOT/USDT pair could dump to the next support at $4.74 and then to $4.65.
Contrary to this assumption, if the price rises and breaks above the 20-day EMA, it will suggest solid buying at lower levels. That could keep the pair range-bound between the 50-day SMA and $5.64 for a few more days.
This article does not contain investment advice or recommendations. Every investment and trading move involves risk, and readers should conduct their own research when making a decision.


