Bitcoin is at a critical crossroad. What are the different possibilities and important levels to watch out for? Let’s analyze the charts.
The traditional financial system is heading to a disaster with about $17 trillion in global bonds returning negative-yields. “The whole concept of negative yields, of people paying for the privilege of lending money, is insane behavior to me,” said William Eigen, a veteran fund manager at JPMorgan Asset Management, in an interview with Bloomberg.
Gemini crypto exchange co-founder Cameron Winklevoss believes that the staggering amount of negative-yield bonds is a compelling reason why investors should gravitate towards Bitcoin (BTC). Stafford Masie, the general manager of WeWork South Africa, also believes that Bitcoin is the best technological gift to mankind and Masie stressed that it will change the future of humanity.
While many see Bitcoin as a game-changer, a few traditional economists still do not realize its potential. In a recent panel discussion, economist Nouriel Roubini said that tokenizing assets is a huge step backward as it will take us back to the stone age. Typicaly Roubini airs several reasons why he believes Bitcoin will not go anywhere but he did confess that maybe it is a partial store of value.
Any new asset class has to go through a difficult phase of adoption. There will be phases of utter disappointment in between, but in the long run, a good innovation will find its due place. Should traders view the current dip as a buying opportunity or could cryptocurrencies fall further? Let’s analyze the charts.
BTC/USD
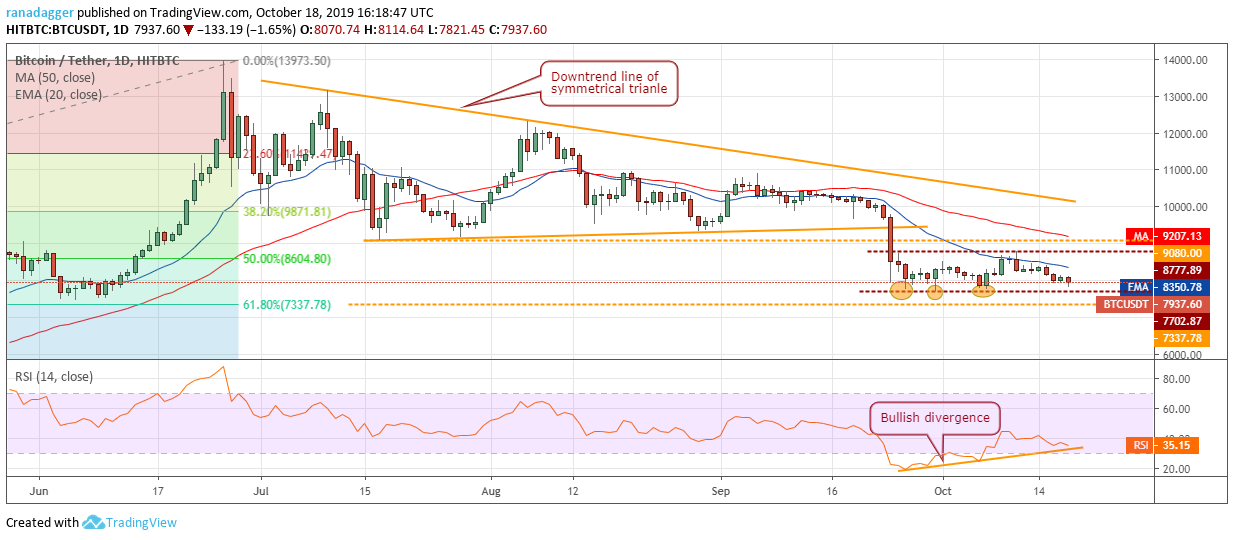
Will Bitcoin bounce from the support at $7,702.87 or will it plunge below it and dent investor sentiment? Let’s look at both the positive and the negative scenarios that the chart projects.
The bulls have defended the support at $7,702.87 on three previous occasions. This shows that buyers accumulate when the price dips to this level. The bullish divergence on the RSI is another positive sign.
A strong bounce off $7,702.87 will increase the possibility of a move to the top of the range at $8,777.89. If the bulls can scale this resistance, it will be the first indication that buyers are back in the game. A breakout and close (UTC time) above the downtrend line of the symmetrical triangle will confirm a change in trend.
Conversely, both moving averages are sloping down and the RSI is nearing the oversold zone, which suggests that bears have the upper hand. This is the fourth time the BTC/USD pair has revisited $7,702.87 in just under a month. Repeated retests of a support level weaken it.
If $7,702.87 fails to hold, it will trigger the stops of the aggressive traders who have purchased in this consolidation. The next support is at $5,533, which is the 78.6% Fibonacci retracement level of the most recent rally. We suggest aggressive traders protect their long positions with stops at $7,700. The pair is likely to take a decisive directional move within the next few days.
ETH/USD
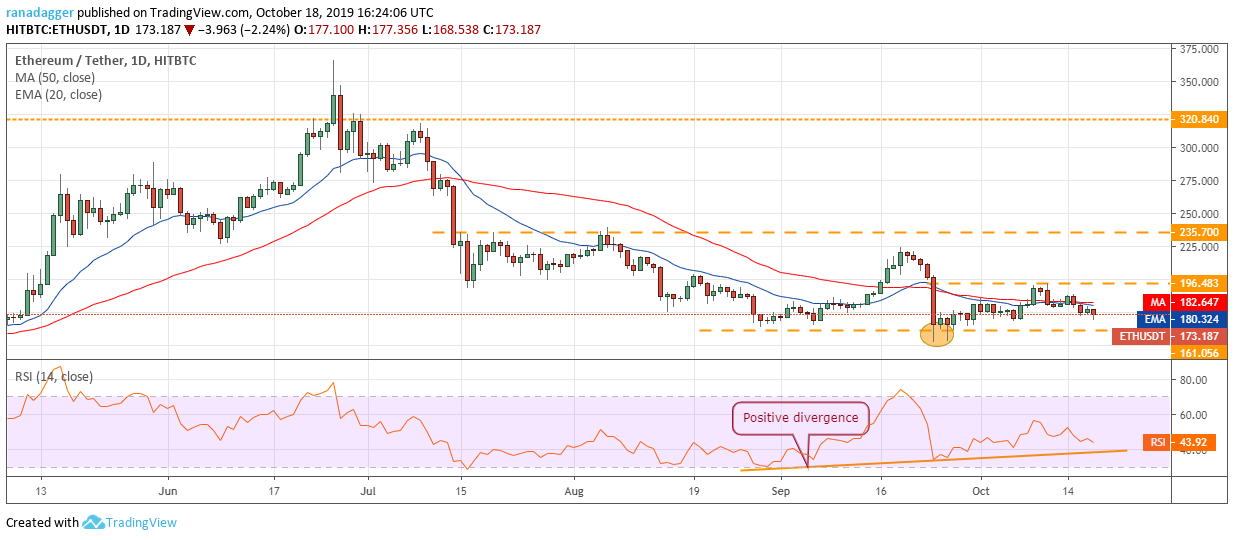
Ether (ETH) continues to face selling even on minor rallies. It is now likely to drop to the critical support zone of $161.056 to $151.829. Towards the end of September, dips to this range were quickly purchased. Therefore, we anticipate the bulls to defend this area once again.
If the ETH/USD pair rebounds sharply from the support zone, the bulls will attempt to push it back towards the top of the tight range at $196.483. A breakout and close (UTC time) above this level will open the doors for a rally to $235.70.
Contrary to our assumption, if the bears sink the ETH/USD pair below the support zone, a fall to $122 is possible. Aggressive traders can retain the stop loss on the long positions at $160.
XRP/USD
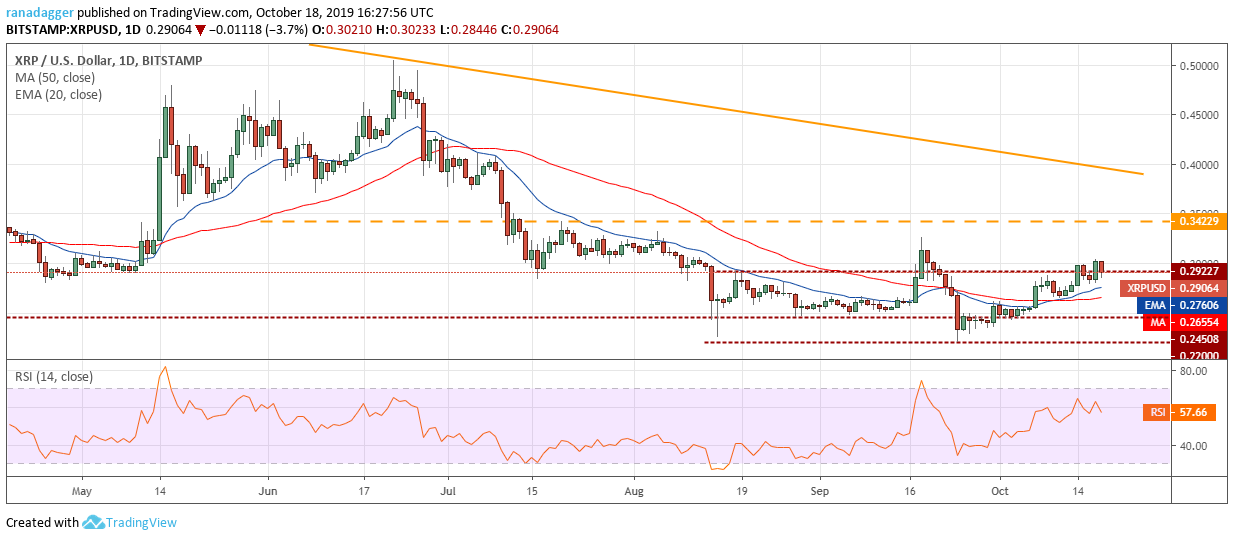
XRP bounced sharply from close to the 20-day EMA on Oct. 17 that carried it above $0.30. However, the bulls are struggling to sustain the price above $0.29227. This shows selling at higher levels. The bears will now try to sink the price below both moving averages. If successful, a drop to $0.24508 and below it to $0.22 is likely.
However, with the 20-day EMA turning up and the RSI in the positive territory, the advantage is on the side of the bulls. If the XRP/USD pair rebounds off the 20-day EMA once again, it will increase the possibility of a move to $0.34229. Therefore, traders can hold long positions but raise the stop loss to $0.24.
BCH/USD
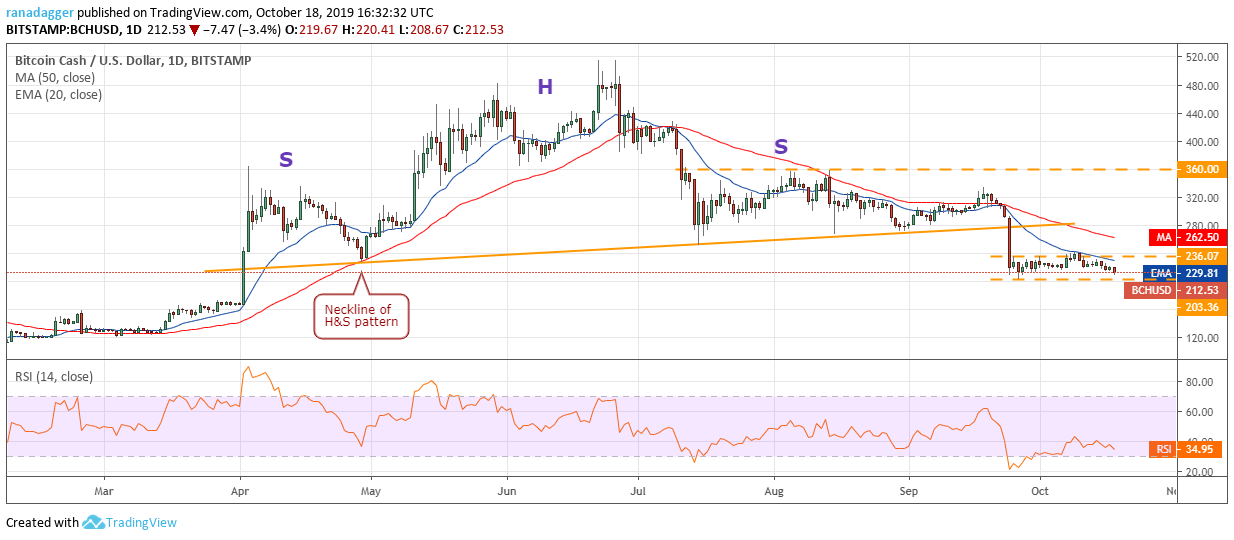
Bitcoin Cash (BCH) continues to slide towards the critical support of $203.36. Both moving averages are turning down and the RSI is close to the oversold zone which shows that bears are in command. The failure of the bulls to even pull back to the neckline of the head and shoulders pattern shows a lack of urgency among buyers.
A breakdown below $203.36 will resume the down move and the next level to watch is $166.98. Conversely, if the BCH/USD pair rebounds off $203.36, price will remain range-bound for a few days. A breakout of $236.07 will be the first indication that buyers are back in action. We will wait for the decline to end a new buy setup to form before proposing a trade in it.
LTC/USD
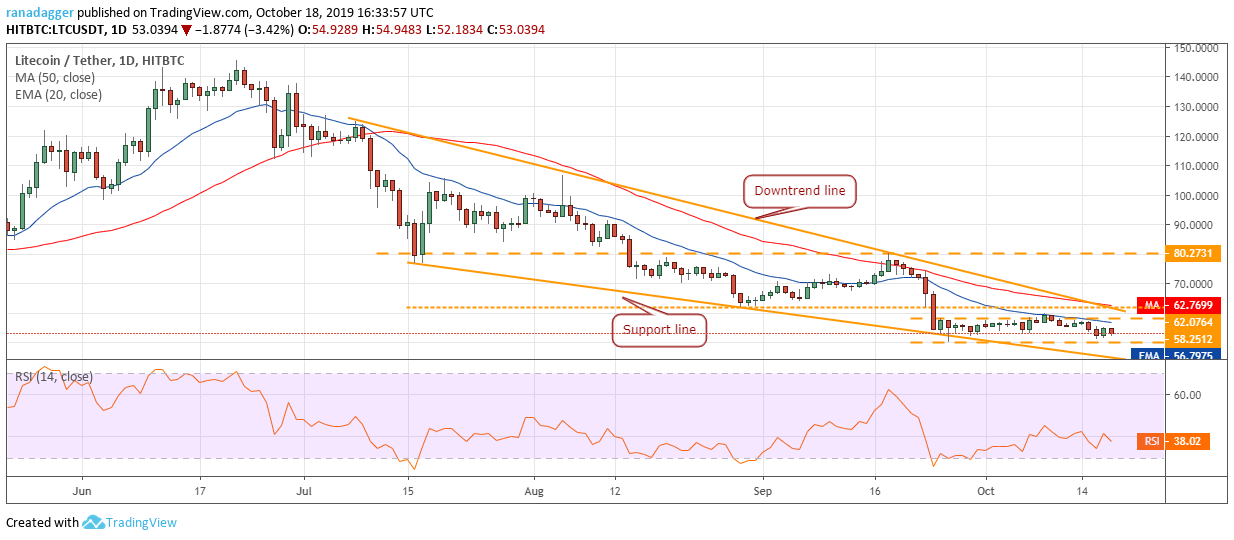
The bulls have held the support at $50 for the past two days but have not been able to achieve a strong bounce off it. This shows that buying dries up at higher levels. If the bulls fail to push the price above the 20-day EMA within the next few days, the bears will try to sink Litecoin (LTC) below $50.
The gradually sloping moving averages and the RSI below 50 suggests that bears have the upper hand. If the support at $50 cracks, the downtrend will resume and the decline can extend to $40.
If the LTC/USD pair rebounds off $50, it might extend its stay inside the range for a few more days. We will recommend a long position after the price breaks out and sustains above the 50-day SMA.
EOS/USD
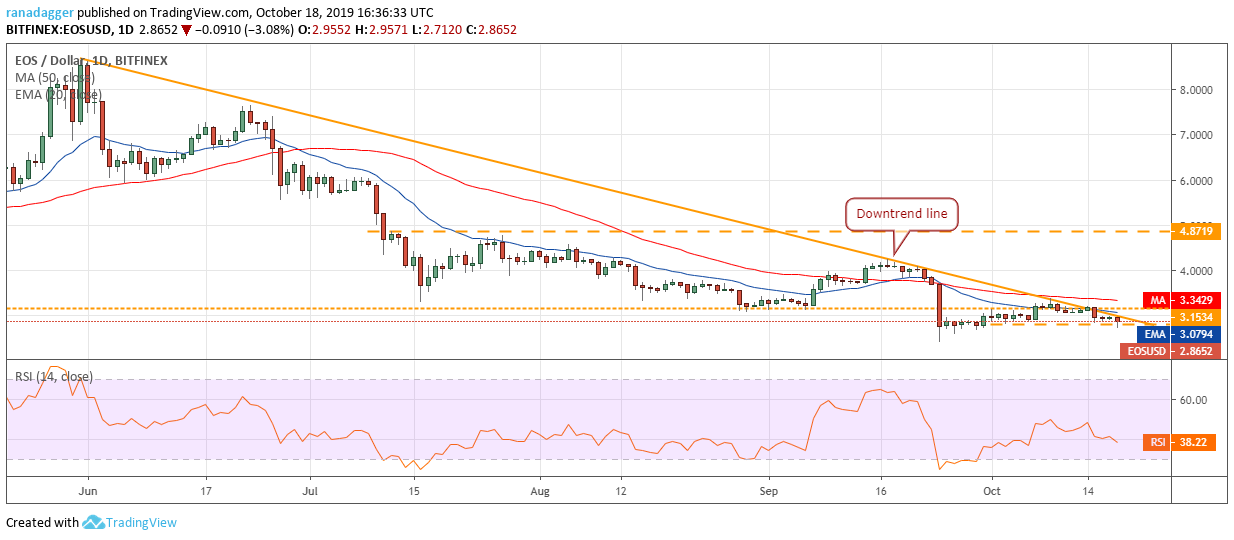
EOS has broken down from the immediate support at $2.8129. If the bears can sustain the price below this level, a retest of the recent lows of $2.4001 will be on the cards. The 20-day EMA has started to turn down once again and the RSI has slipped into the negative zone, which suggests that bears have the upper hand. If the bears sink the price below $2.4001, a retest of the yearly lows at $1.55 will be on the cards.
If the support zone between $2.8129 to $2.4001 holds, the EOS/USD pair might consolidate for a few more days. It will turn positive on a breakout and close (UTC time) above $3.4. For now, we retain the buy recommended in an earlier analysis.
BNB/USD
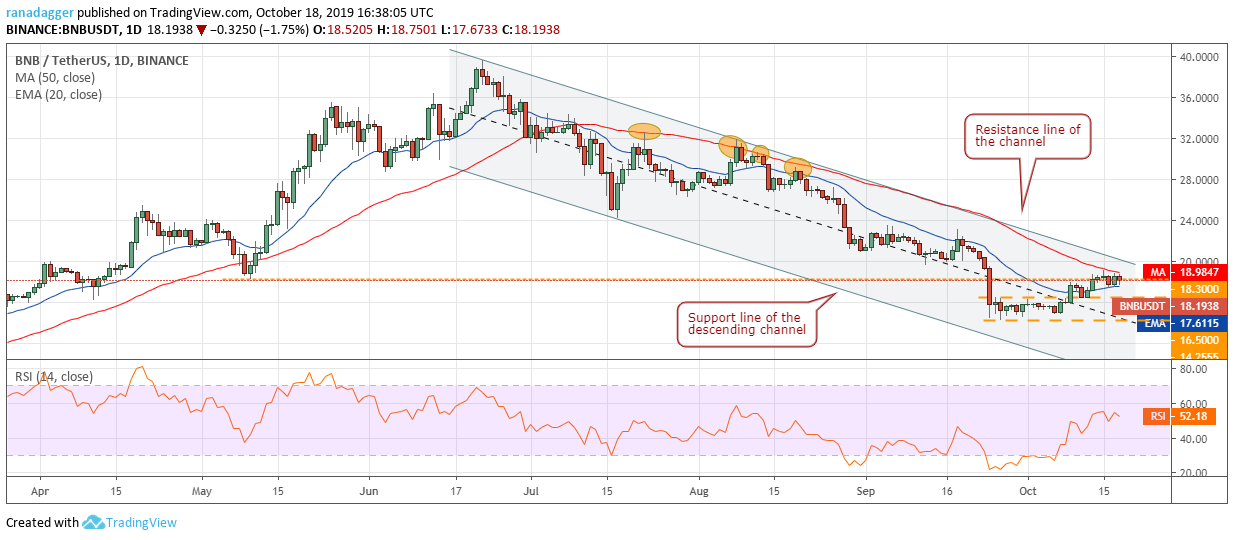
Binance Coin (BNB) is stuck between both the moving averages for the past three days. This contraction in the range is likely to be followed by a range expansion. If the range expands to the upside and the bulls push the price above the resistance line of the channel, it will indicate a change in trend. Therefore, traders can initiate long positions as suggested by us in an earlier analysis.
However, if the range expands to the downside with a break below the 20-day EMA, the bears will attempt to sink the BNB/USD pair to $14.255. If this support also fails to hold, the next stop will the support line of the descending channel.
However, we give this a low probability of occurring because the moving averages have flattened out and the RSI has risen above 50, which suggests that the selling pressure has subsided.
BSV/USD
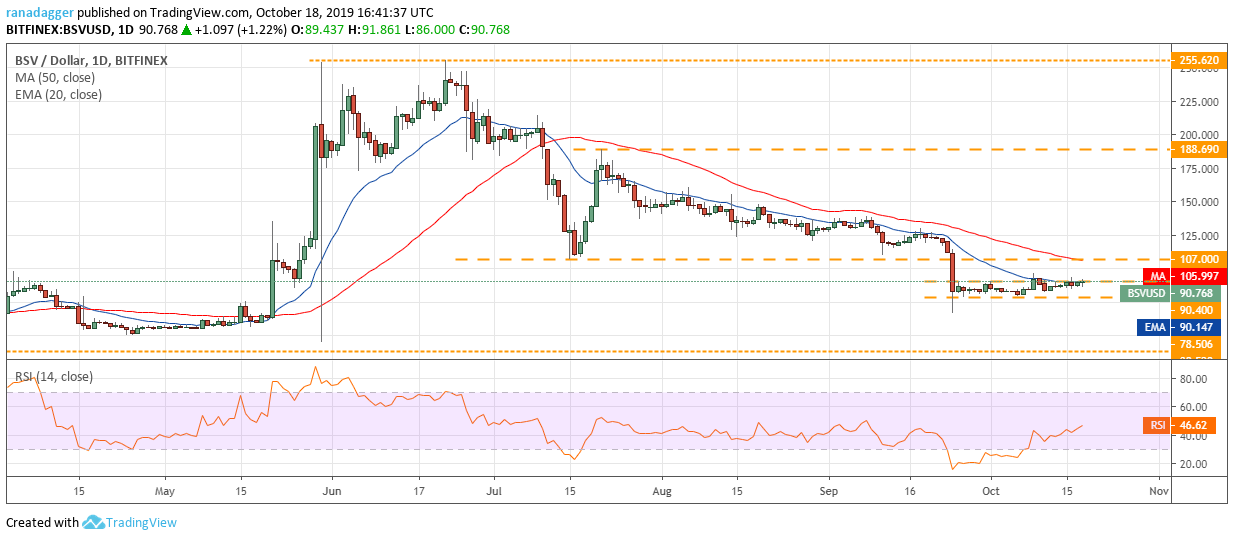
Bitcoin SV (BSV) has been trading close to the overhead resistance of $90.40 for the past four days. The 20-day EMA has flattened out and the RSI has gradually climbed close to the midpoint. This suggests that the selling pressure has reduced.
If the bulls can push the price above $90.40, a rally to $107 is possible. We anticipate a stiff resistance close to this level as the 50-day SMA is still sloping down and the bulls have not been able to push the BSV/USD pair above it since July 11. We will wait for a new buy setup to form before suggesting a trade in it. The downtrend will resume if the pair slips below the $78.506 to $66.666 support zone.
XLM/USD
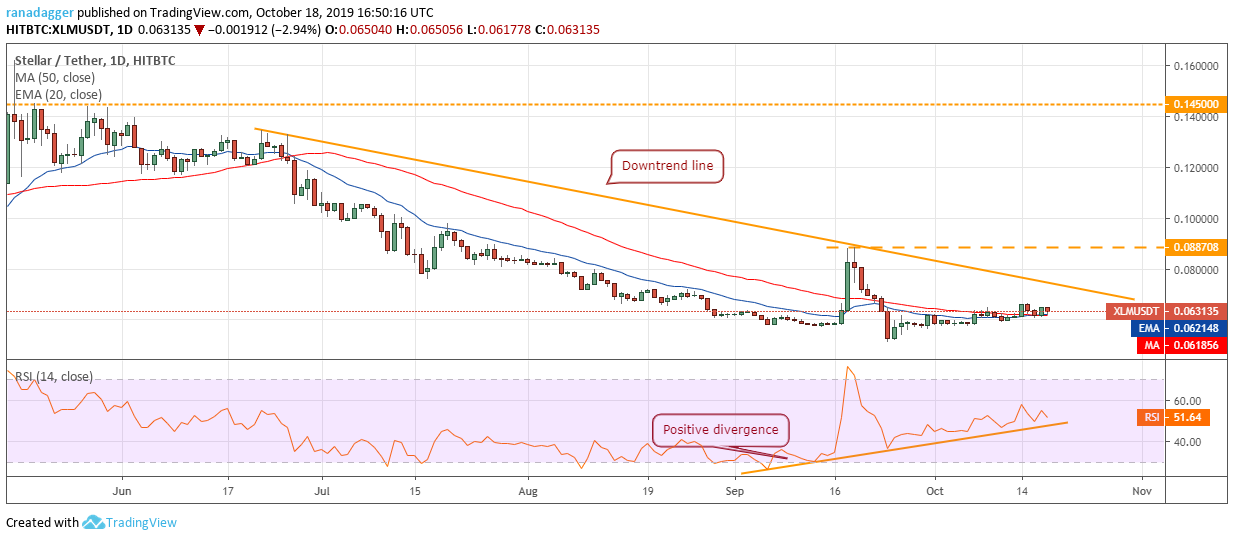
Stellar (XLM) has been trading above the moving averages for the past four days but the bulls have not been able to take advantage of it. If the price does not scale above $0.066628 within the next few days, the bears will try to sink it below the moving averages.
If the price sustains below the moving averages, a drop to $0.057 and below it to $0.051014 is possible. The downtrend will resume on a break below $0.051014. Therefore, traders can protect their long positions with a stop loss of $0.051.
However, if the bulls can propel the XLM/USD pair above $0.066628, a move to the downtrend line and above it to $0.088708 is possible.
LEO/USD
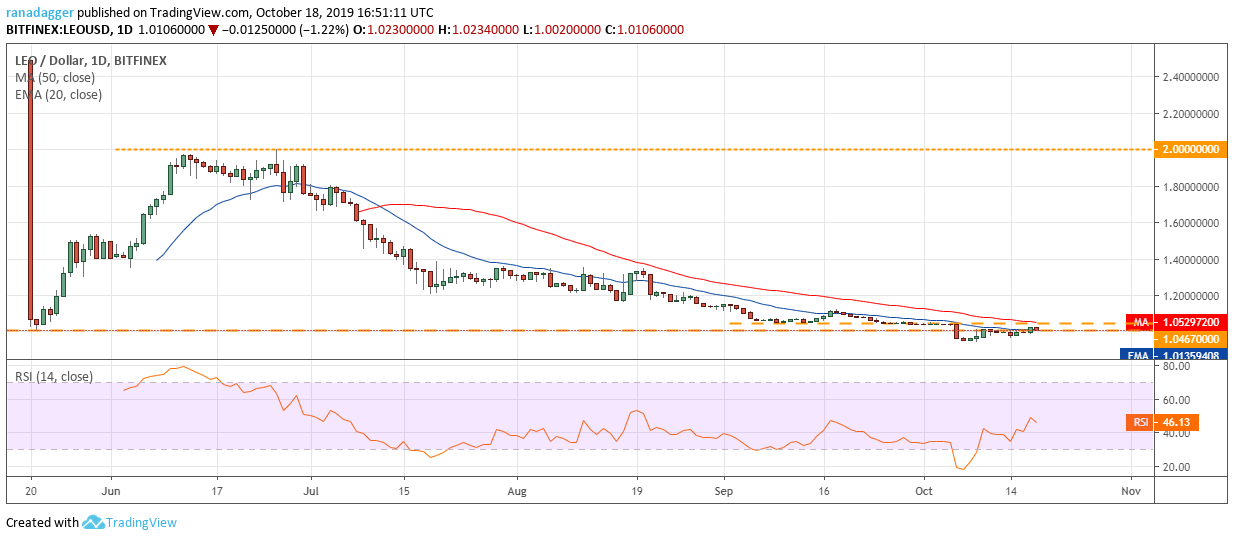
Unus Sed LEO (LEO) has once again made an entry into the top ten cryptocurrencies by market capitalization, and for this reason it has been included in this analysis. The cryptocurrency plummeted to a new yearly low on Oct. 06, which is a bearish sign.
Currently, the LEO/USD pair is retesting the breakdown zone of $1.0075 to $1.0467. If the bulls can scale above this zone, it will indicate that the most recent breakdown was a bear trap. We might suggest a long position if the price sustains above $1.0467.
On the other hand, if the price turns down from the zone, it can correct to $0.9410. If this level also fails to hold, the pair will resume the downtrend.
The views and opinions expressed here are solely those of the author and do not necessarily reflect the views of CryptoX. Every investment and trading move involves risk. You should conduct your own research when making a decision.
Market data is provided by HitBTC exchange.


