Altcoins are on fire. Can this rally continue and is this a good time to buy? Let’s analyze the charts.
The Chicago Board Options Exchange has withdrawn its application for the VanEck/SolidX Bitcoin (BTC) exchange-traded fund (ETF). However, VanEck’s director of digital asset strategies Gabor Gurbacs stated that they will continue to work with regulators to bring “a physical, liquid and insured ETF” to the market. Bitcoin had a muted reaction to this news, which is a positive sign.
Blackstone CEO Steve Schwarzman said that blockchain technology is good and will be adopted. However, he was not supportive of the idea of using blockchain technology for generating money. While crypto enthusiasts like the decentralized nature of cryptocurrencies, Schwarzman was against it. He believes that currencies need to be controlled by some central agency.
Germany’s government has passed a blockchain strategy that will prevent private companies from issuing currencies that will threaten state sovereignty and put consumers at risk. This means that Facebook’s Libra will face strong opposition in Europe.
After a long time, altcoins are making a comeback. While the total market capitalization continues to climb, Bitcoin’s dominance has decreased to 67.3%. Is this a good time to buy altcoins? Let’s find out.
BTC/USD
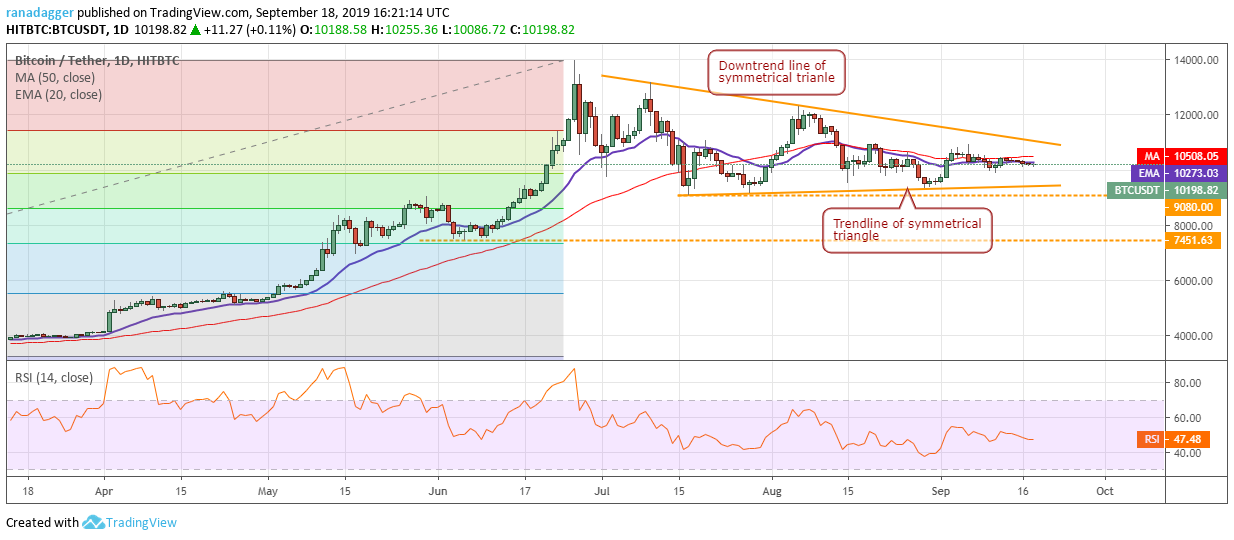
Bitcoin is getting ready for a large move within the next few days. However, it is difficult to predict the direction of the move. Therefore, traders should be ready with a plan of action for a breakout as well as breakdown.
A breakout above the downtrend line is likely to result in a sharp move to $13,973. Though there are minor resistances in between the current level and the yearly high, the momentum will be strong enough to break out of them. Therefore, traders should buy on a breakout above $11,000 without waiting for the price to close (UTC time) above it. The stop loss can be kept at $9,000.
Conversely, if the BTC/USD pair turns down from current levels and plummets below $9,080, the traders should avoid bottom fishing because a quick fall to $7,451.63 is likely. A breakdown will dent sentiment and will delay the start of the uptrend.
Sometimes, the first move out of a tight range turns out to be a fake out. If the breakdown below $9,080 fails to sustain and quickly turns around, then it might offer a good buying opportunity. Hence, traders should keep a close watch and act accordingly.
ETH/USD
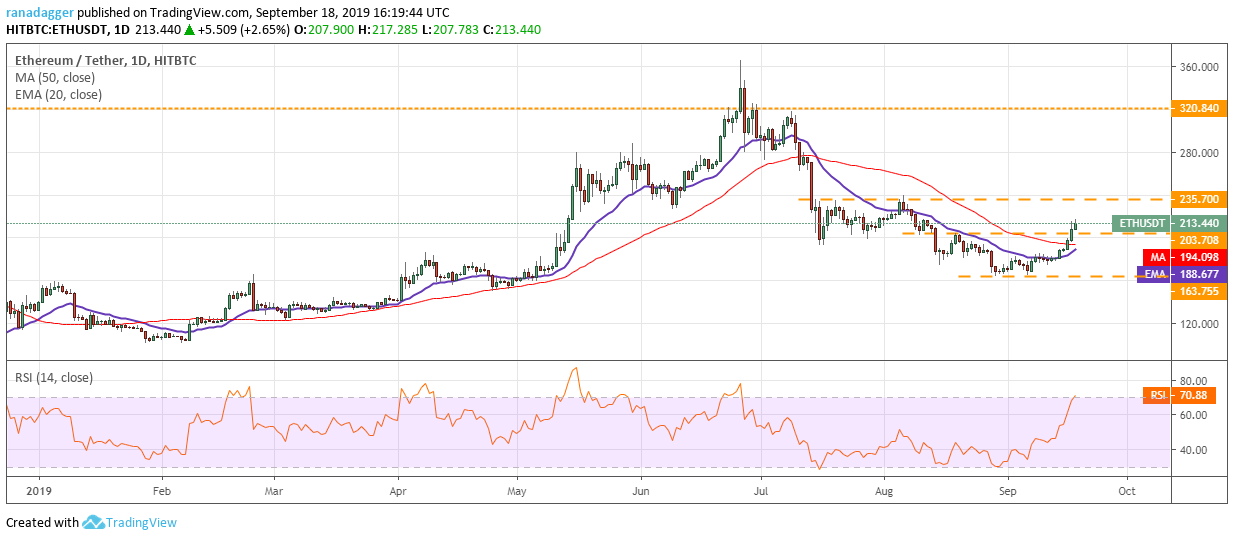
Ether (ETH) broke out of the 50-day SMA on Sept. 16 and followed it up with further gains that have propelled it above $203.78. This is a positive sign and indicates a change in trend. The next level to watch is $235.70, above which it is likely to pick up momentum.
The 20-day EMA has started to turn up and the moving averages are on the verge of a bullish crossover, which suggests that bulls have the advantage in the near term. Traders can buy 50% of the desired allocation on dips to $203.78 and keep an initial stop loss of $160. The rest of the position can be added on dips to the moving averages or on a breakout above $235.70.
Our bullish view will be invalidated if the price turns down from current levels and plummets below $163.755. Such a move will indicate that the current move was only a dead cat bounce.
XRP/USD
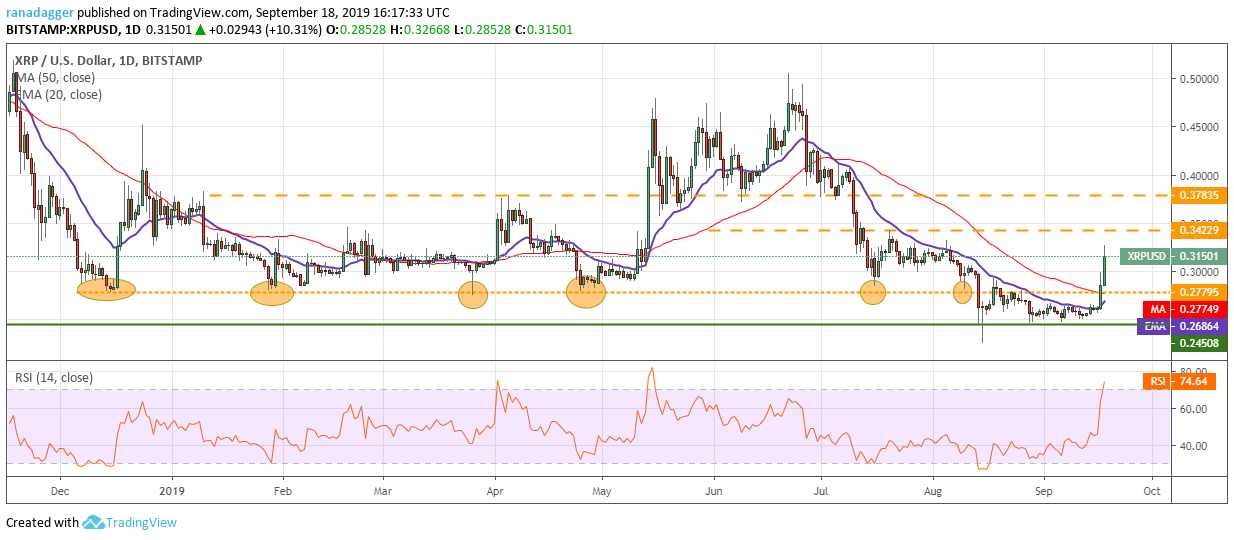
After trading in small ranges for the past few days, XRP surged higher on Sept. 17 and broke above both moving averages and the overhead resistance at $0.27795. This is a positive sign as the rise above $0.27795 indicates that the markets have rejected the lower levels.
Back to back positive days with large range moves shows that traders who were waiting on the sidelines for a confirmation of a bottom have jumped in. The XRP/USD pair will now rise to $0.34229 and above it to $0.37835 where it is likely to face some resistance. We will wait for the price to stabilize before recommending a trade in it. Our bullish view will be invalidated if the rally fizzles out at current levels and again plunges below the moving averages. However, we give it a low probability of occurring.
BCH/USD
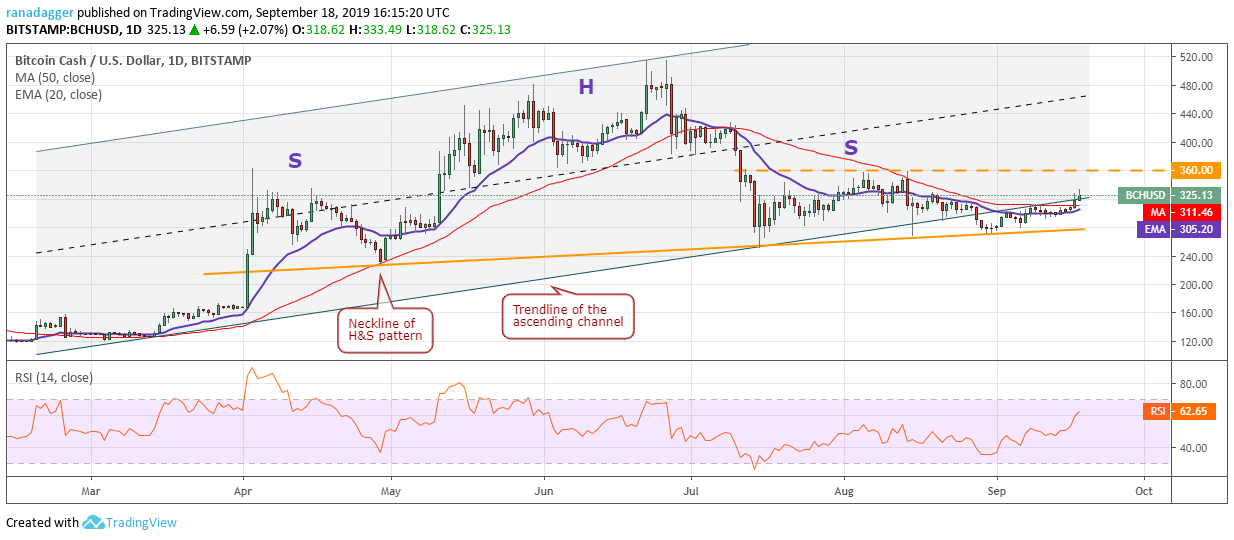
The tight range trading between the moving averages resolved to the upside. Bitcoin Cash (BCH) can now move up to the critical resistance of $360. If bulls push the price above $360, a new uptrend is likely.
However, if the BCH/USD pair turns down from $360, it might remain range-bound for a few more days. It will turn negative on a breakdown and close (UTC time) below the neckline of the head-and-shoulders pattern. We will wait for the price to break out above $360 before proposing a trade in it.
LTC/USD
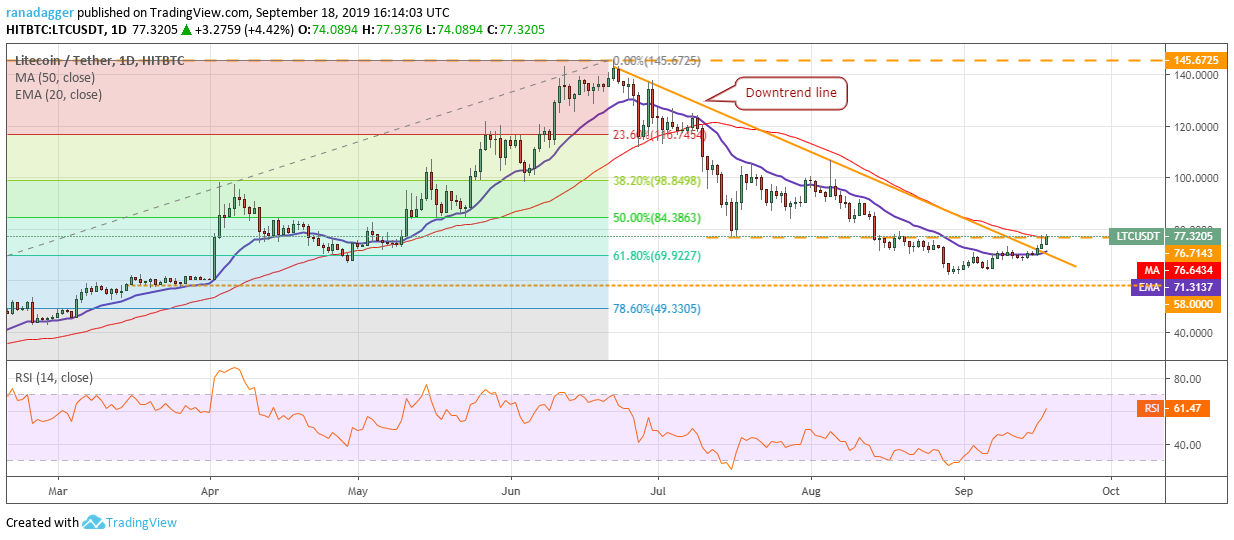
Litecoin (LTC) broke out of the 20-day EMA and the downtrend line on Sept. 16 which confirmed that the downtrend has ended. It is currently facing resistance at the 50-day SMA, above which it is likely to start a new uptrend.
The traders can buy on a close (UTC time) above $76.7143 and keep a stop loss of $62. The first target to keep in mind is $106 and above it $125. Nonetheless, if the LTC/USD pair fails to break out and close (UTC time) above $76.7143, it will remain range-bound for a few days. Our bullish view will be invalidated on a break below the $62.0764–$58 support zone.
EOS/USD
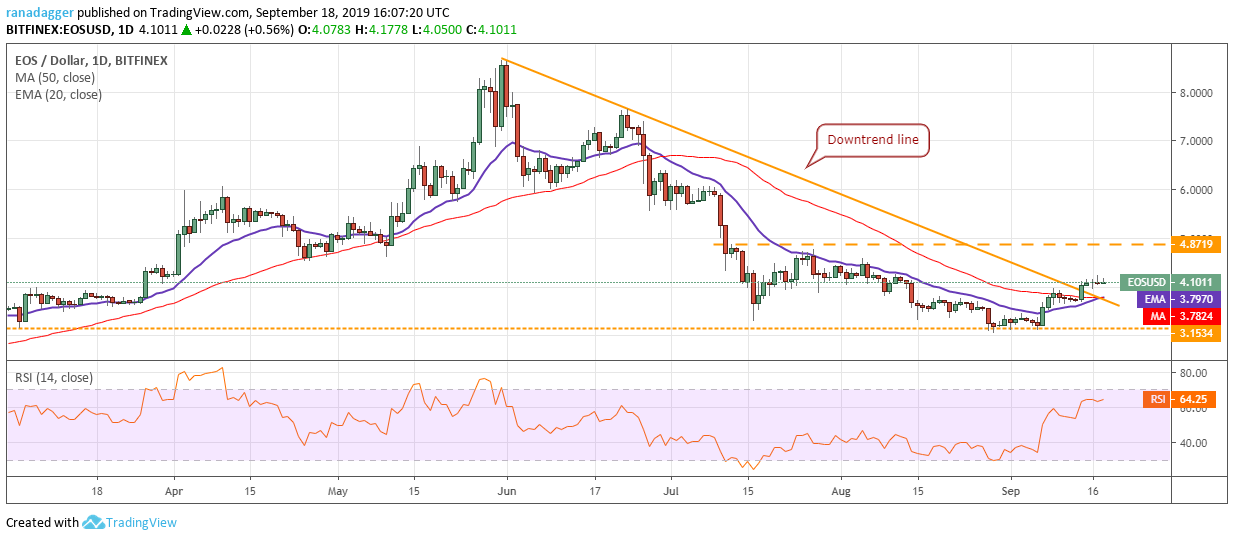
EOS has sustained above the downtrend line for the past three days but it has failed to pick up momentum. The moving averages are on the verge of a bullish crossover and the RSI is in the positive territory, which suggests that bulls have the upper hand.
Our first target objective is a rally to $4.8719 and above it, we expect the EOS/USD pair to pick up momentum and move up to $6. Our assumption will be negated if the price reverses direction from current levels and plummets below $3.1534. Therefore, we suggest traders hold long positions with the stop loss at $3.
BNB/USD
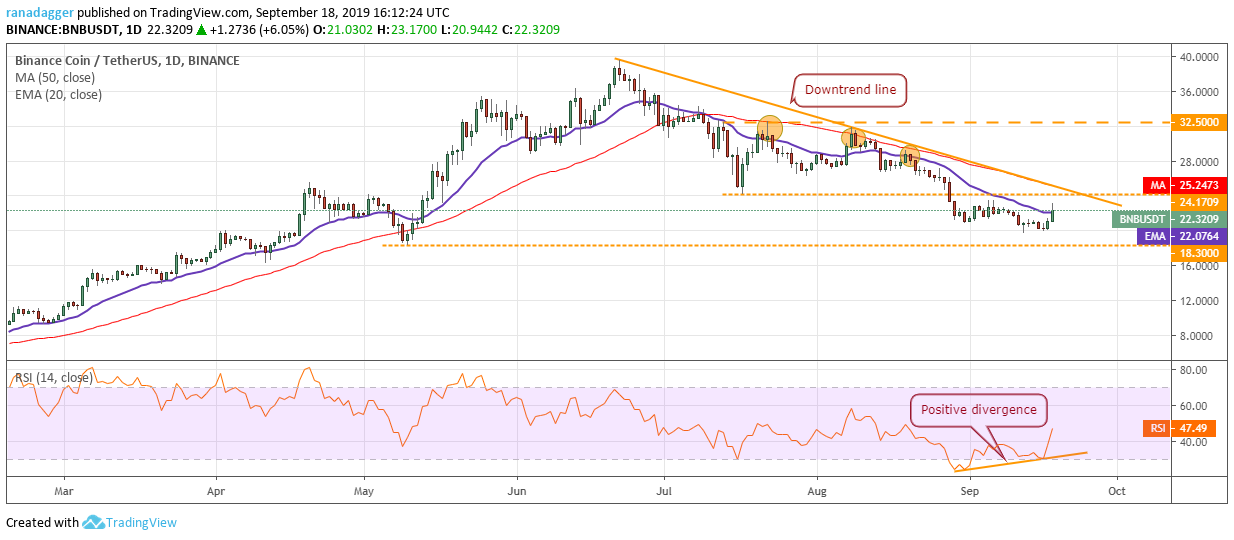
Binance Coin (BNB) has pulled back to the 20-day EMA and the RSI is forming a bullish divergence, which is a positive sign. Above the 20-day EMA, the pullback will reach the 50-day SMA. This is an important resistance to watch out for because the price has returned from it on three occasions (marked as ellipses on the chart).
If bulls push the price above the 50-day SMA, a rally to $32.50 will be in the cards. Conversely, if the price turns down from the 50-day SMA, the BNB/USD pair might remain range-bound for a few days. The pair will turn negative on a breakdown of $19.65–$18.30 support zone. The traders can initiate long positions on a breakout and close (UTC time) above the 50-day SMA with a stop loss of $19.50.
BSV/USD
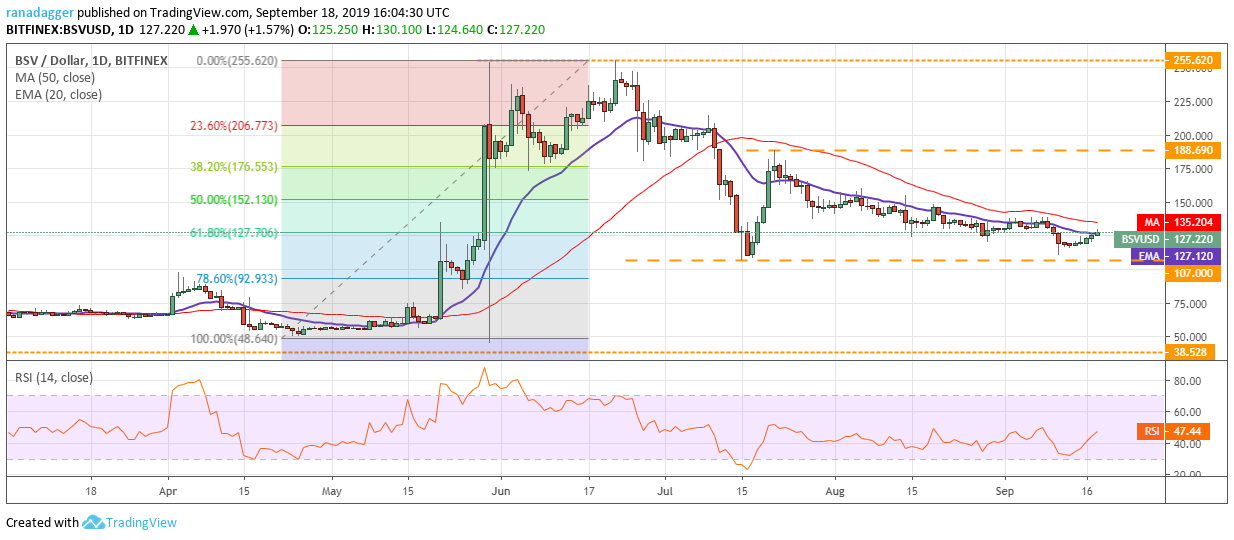
Bitcoin SV (BSV) has pulled back to the 20-day EMA, above which it can move up to the 50-day SMA. This shows that bulls are using dips to $107 to buy. However, the pullback lacks strength, hence, we are not proposing a trade at current levels.
A breakout of the 50-day SMA will face some resistance at $150, but if the bulls propel the BSV/USD pair above this level, a move to $188.69 is possible. The trend will turn negative if the bears sink the pair below the critical support of $107.
XLM/USD
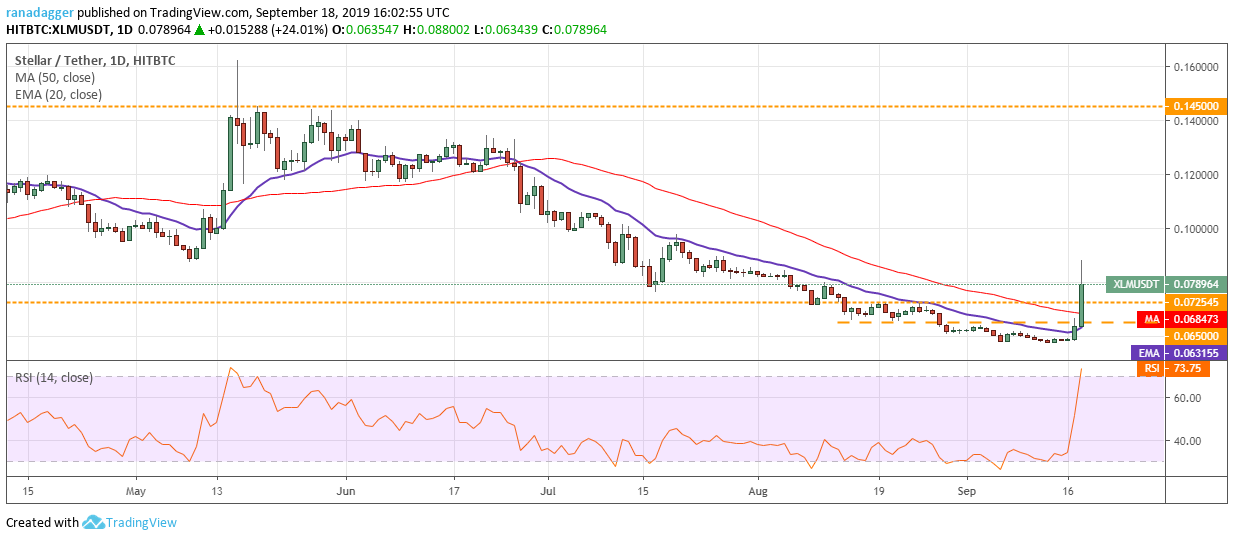
Stellar (XLM) has surged in the past two days and has re-entered into the list of top 10 cryptocurrencies by market capitalization. For the first time since June 25, it broke out and closed (UTC time) above the 20-day EMA on Sept. 17. That was followed by another strong move, which has carried the price well above the 50-day SMA. This confirms that the downtrend is over.
The XLM/USD pair is currently facing some profit booking at higher levels but its target remains $0.10. If this level is also scaled, the pair might move up to $0.13. However, we do not suggest chasing prices higher. Therefore, traders should wait for the price to enter a minor correction or consolidation before buying. Though positive, we do not find a trade setup with a good risk-to-reward ratio at current levels, hence, we are not suggesting a trade in it.
ADA/USD
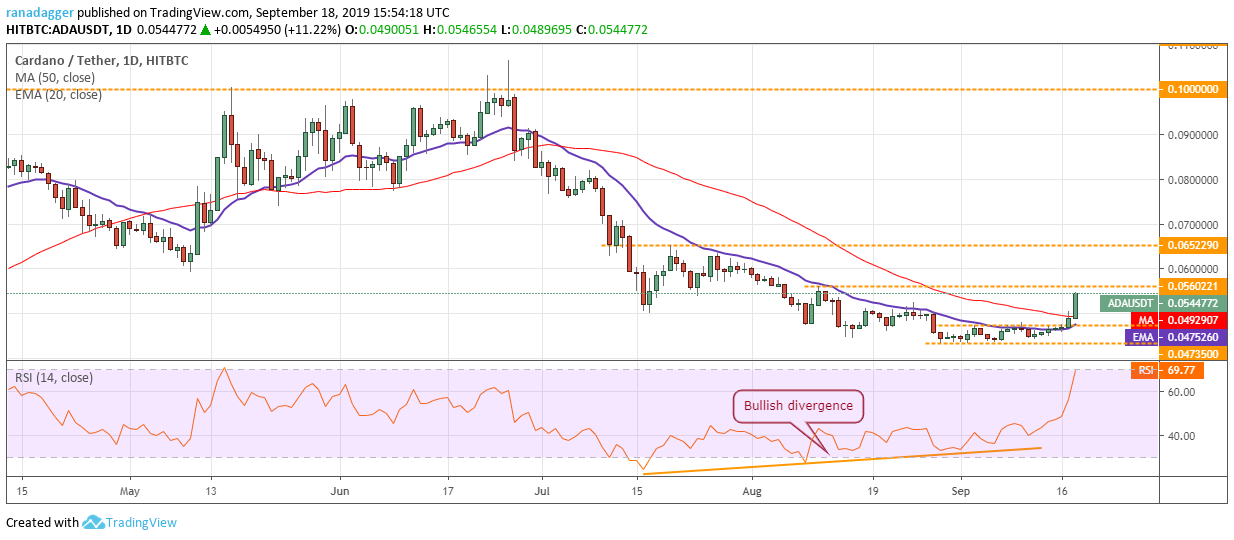
Cardano (ADA) rose above the 50-day SMA on Sept. 17, but did not close (UTC time) above it, hence, our buy suggestion given in the previous analysis did not trigger. Currently, the price has risen sharply above the 50-day SMA. There is a minor resistance at $0.0560221 above which a rally to $0.0652290 is possible.
Both moving averages are on the verge of a bullish crossover, which confirms a change in trend. Instead of chasing the price higher, the traders can wait for the price to dip toward $0.050 to initiate long positions. The stop loss can be kept at $0.043. Our bullish view will be invalidated if the ADA/USD pair turns down from the overhead resistance and dips below both moving averages.
The views and opinions expressed here are solely those of the author and do not necessarily reflect the views of CryptoX. Every investment and trading move involves risk. You should conduct your own research when making a decision.
Market data is provided by HitBTC exchange.

