Many major cryptocurrencies were rejected at their overhead resistances which shows weakness within the market. Is a bear market developing?
The crypto market has been struggling since topping out in June but this does not mean institutional interest in crypto has diminished. The Chicago Mercantile Exchange (CME) Group tweeted that customer interest in CME Bitcoin (BTC) futures remained strong in Q3 2019 compared to Q3 2018. The total increase in open interest during this period was about 61%, which shows that the involvement of institutional traders is on the rise.
Similarly, digital asset manager Grayscale Investments reported that its products received a total investment of $254 million in Q3 2019. That was a sharp increase over Q2 2019 when the investment amount was $84.8 million. 84% of the investments came from institutional investors, which shows that they continue to accumulate on dips.
While this is a positive sign, the regulatory hurdles faced by Facebook and Telegram have weakened sentiment. The recent rejection of the Bitcoin exchange-traded fund proposal has not helped either. Though the markets are in the red, there is no reason to panic yet since most major cryptocurrencies are still trading above their recent support levels.
Given the current state of the market, traders will closely watching to determine which levels to watch out for. Let’s analyze the charts to gain a better view of the market.
BTC/USD
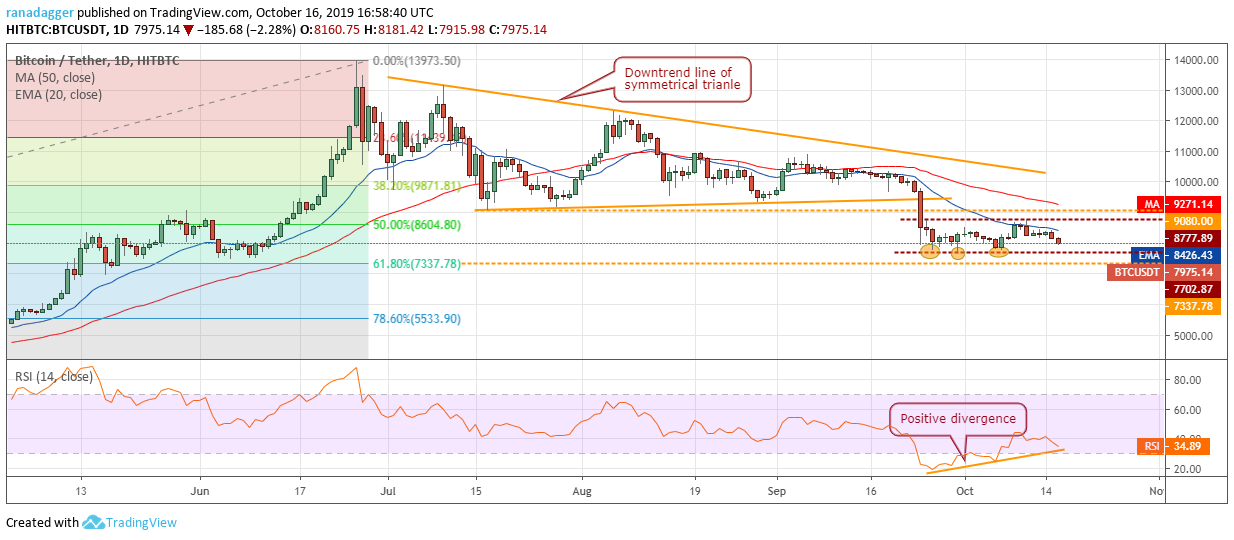
From the top of the $7,702.87 to $8,777.89 range, Bitcoin has dipped close to the bottom. After failed attempts by the bulls to break out of the range, the bears will now try to breakdown from it. The critical support zone to watch out on the downside is $7,337.78 to $7,702.87.
If the support zone cracks, the downtrend will resume and the next strong support is way lower at $5,533, which is the 78.6% Fibonacci retracement level of the most recent rally. The downsloping moving averages and the RSI in the negative territory suggest that bears have a slight advantage.
However, as the BTC/USD pair has bounced near $7,702.87 on three occasions, we expect the bulls to defend this area. A bounce off this support will extend the stay inside the range for a few more days. Aggressive traders can maintain the stops on the long positions at $7,700.
The next few days are critical for the cryptocurrency because a decisive breakdown will be a huge negative, but a strong bounce will indicate demand at lower levels and possibly offer a low-risk buying opportunity.
ETH/USD
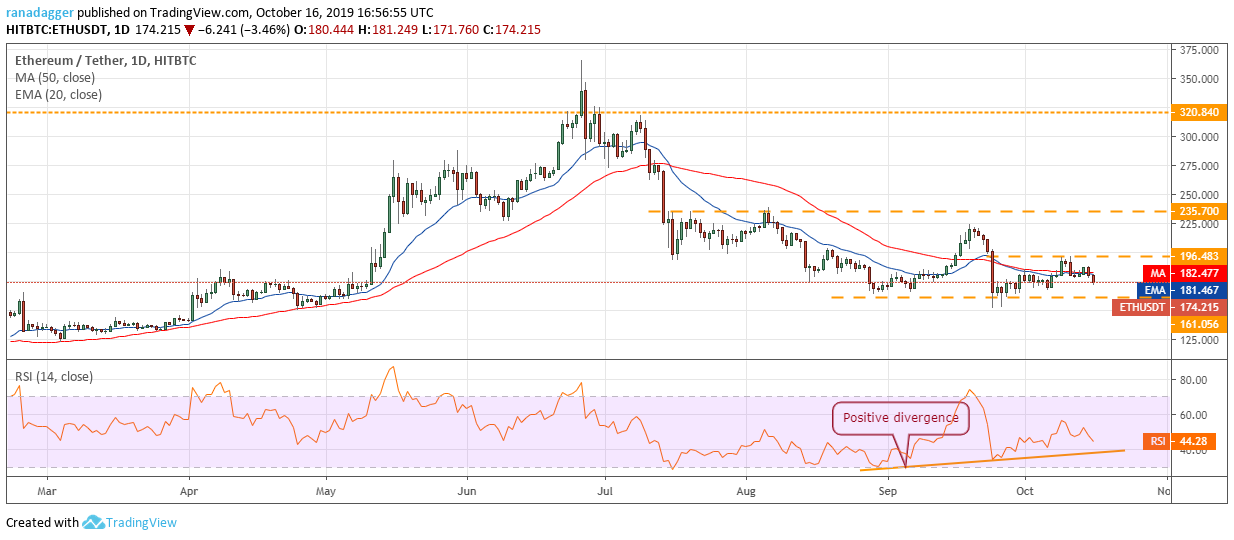
Ether (ETH) turned down from $188.314 on Oct. 15 and broke below the moving averages. This is a negative sign as it shows renewed selling pressure. The bears will now try to sink the price below the $161.056 to $151.829 support zone. If successful, the downtrend will resume with the next stop likely at $122.
Conversely, if the ETH/USD pair rebounds off $161.056, the pair will remain range-bound for a few more days. The pair will turn positive on a break above $196.483. For now, aggressive traders can protect their long positions with a stop of $160.
XRP/USD
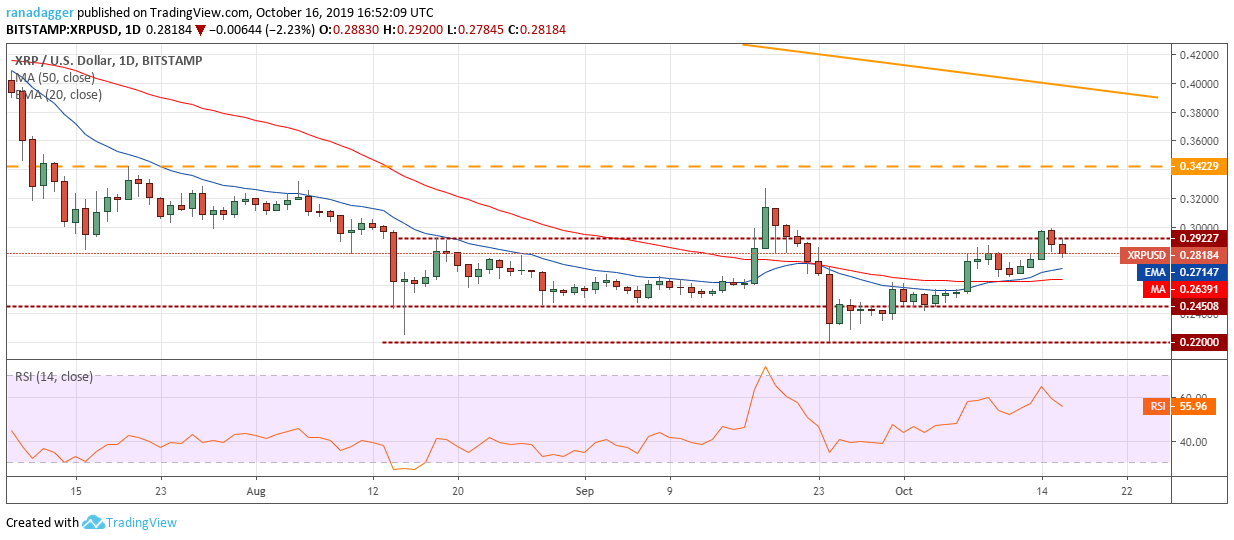
Though XRP broke above the overhead resistance of $0.29227 on Oct. 14, the bulls could not sustain it. This is the second occasion in the past 30-days when the breakout above $0.29927 has not held. This shows that buying dries up at higher levels.
If the bulls buy the dip to the 20-day EMA, the XRP/USD pair will once again attempt to break out and sustain above $0.29927. If successful, a rally to $0.34229 will be on the cards.
Contrary to our assumption, if the bears sink the price below both moving averages, the pair can drop to $0.24508 and below it to $0.22. For now, traders can retain the stop loss on the long positions at $0.215. We will suggest closing the trade earlier if the sentiment remains bearish and the price sustains below the moving averages.
BCH/USD
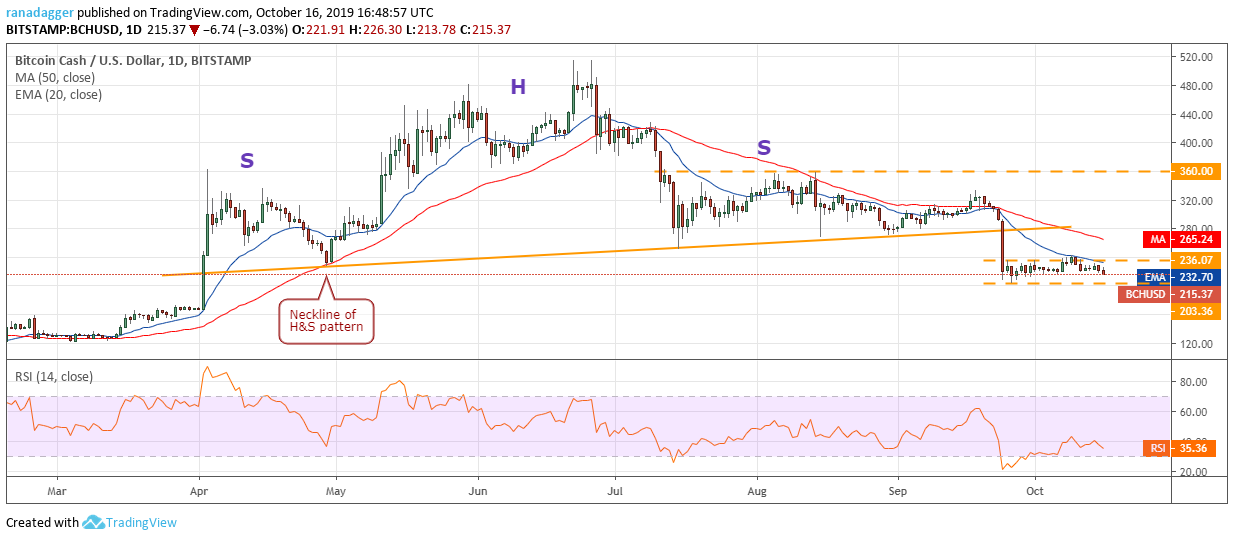
The bears are attempting to sink Bitcoin Cash (BCH) to the bottom of the range at $203.36. If this support cracks, the downtrend will resume and the next stop is likely to be $166.98. With both moving averages turning down and RSI in the negative zone, advantage is with the bears.
However, if the bulls defend the support at $203.36, the BCH/USD pair might extend its stay inside the range for a few more days. A breakout above $241.85 will be the first sign that bulls are back in action. We will wait for a confirmation of a bottom and a reversal pattern to form before proposing a trade in it.
LTC/USD
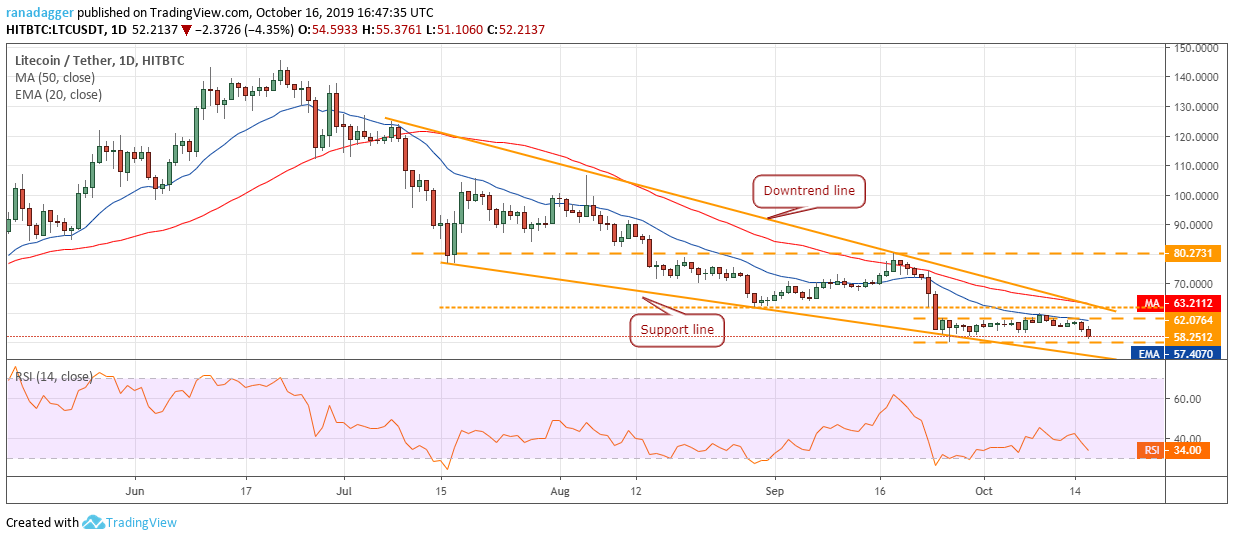
Repeated failures to break out of the 20-day EMA has attracted selling. Litecoin (LTC) can now decline to the critical support at $50. The 20-day EMA has started to turn down and the RSI has dipped back into negative territory, which suggests that bears have the upper hand.
A break below $50 will be a huge negative as it will resume the downtrend. The next stop is likely to be the support line of the falling wedge. If this also fails to hold, the downtrend can extend to $40.
Conversely, if the bulls defend $50, the LTC/USD pair might remain range-bound for a few more days. The pair will indicate a change in trend after it breaks out of the falling wedge. Until then, we suggest traders remain on the sidelines.
EOS/USD
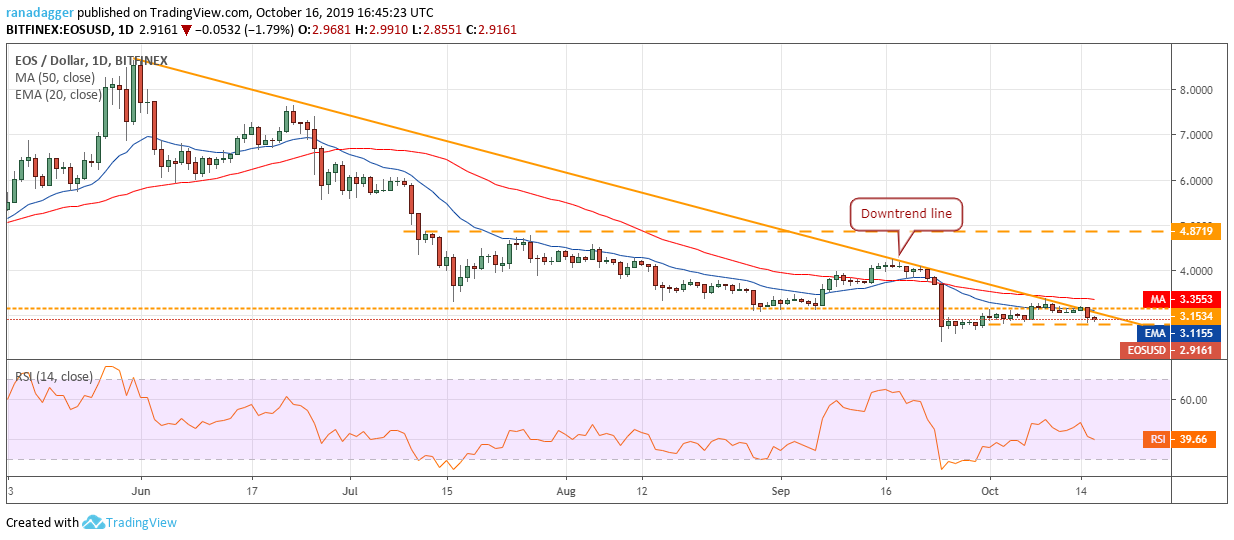
Failure to break out of the downtrend line has attracted selling. EOS has a minor support at $2.8129 below which a retest of the recent lows of $2.4001 is likely. A break below this level can extend the decline to $1.55.
However, if the support at $2.8129 holds, the EOS/USD pair might remain range-bound for a few days. The trend will turn positive on a break out of $3.37. Such a move will indicate that the markets have rejected the levels below $3.1534. Traders can wait for the price to confirm a turnaround before buying as suggested in our earlier analysis.
BNB/USD
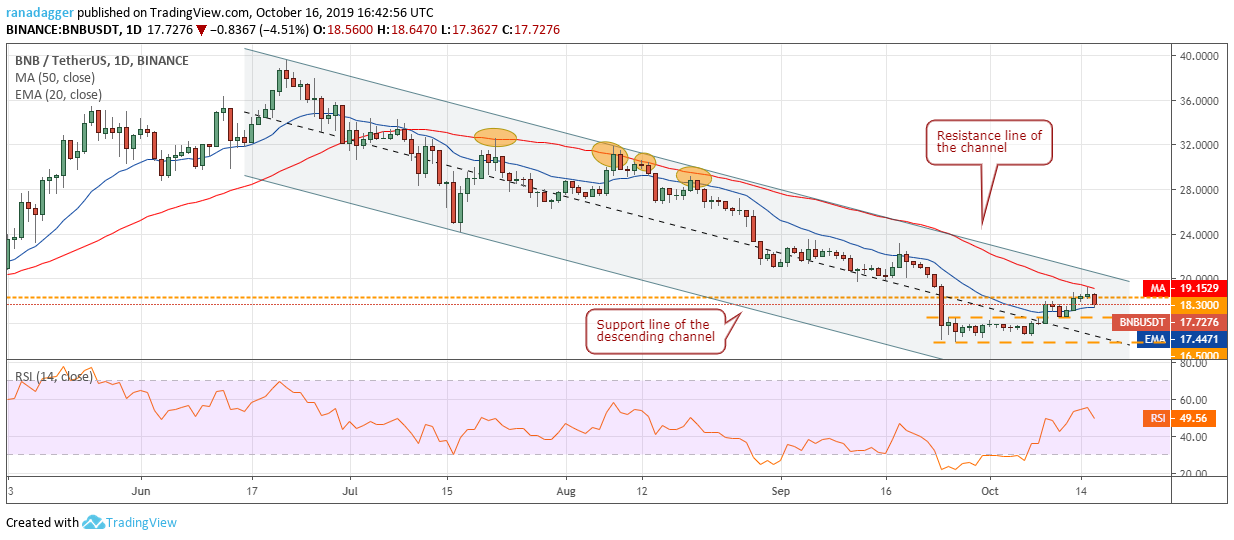
Binance Coin (BNB) scaled the horizontal resistance at $18.30 on Oct. 15 but is facing selling at the 50-day SMA. In this downtrend, the 50-day SMA has been a significant barrier as the price has repeatedly turned down from it.
The BNB/USD pair can now dip to $16.50, which is likely to act as a support. However, if the support cracks, a retest of $14.2555 will be on the cards.
Conversely, if the pair rebounds off $16.50, the bulls will again attempt to push the price above the 50-day SMA and the resistance line of the channel. If successful, it will indicate a change in trend, which can offer a trading opportunity. Hence, we have retained the buy recommendation given in the previous analysis.
BSV/USD
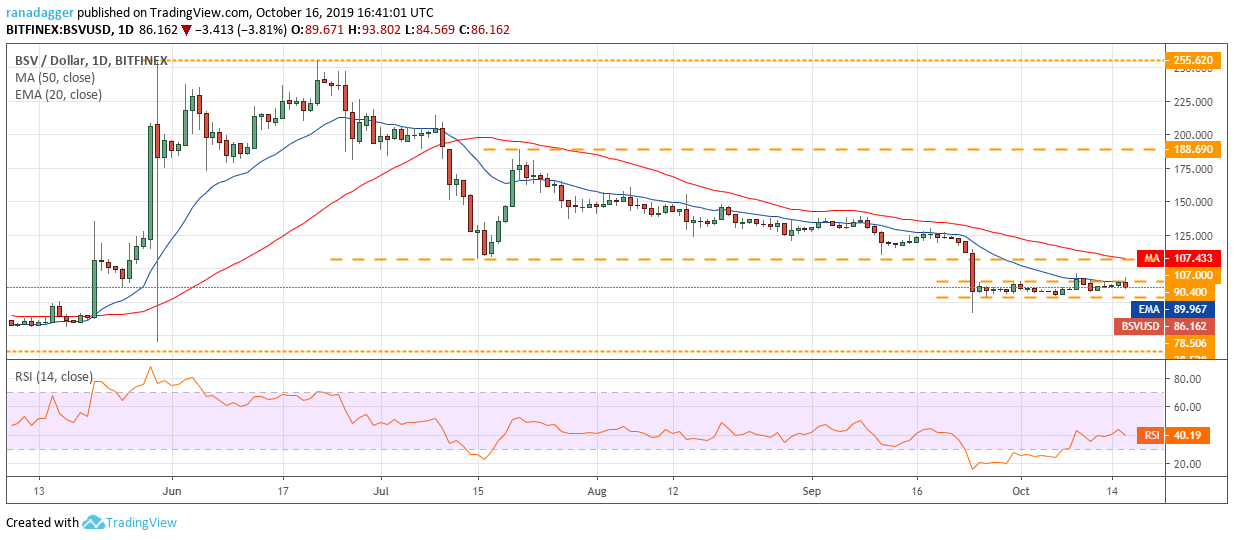
Bitcoin SV (BSV) broke out of the overhead resistance zone of $90.40-$96.77 earlier during the day but could not sustain it. The price has re-entered the range, which shows selling at higher levels.
The bears will now try to sink the price below the support at $78.506. If successful, a retest of the recent lows at $66.666 is possible. Conversely, if the bulls defend the support at $78.506, the BSV/USD pair might extend its consolidation for a few more days. We do not find a reliable buy setup at the current levels, hence, we are not proposing a trade in it.
XLM/USD
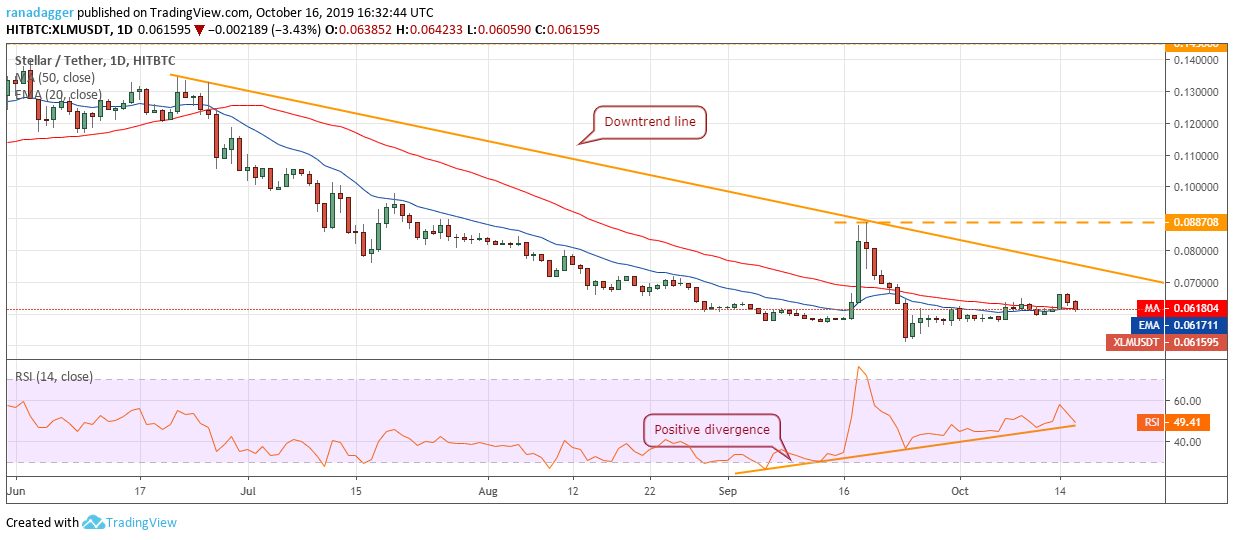
Stellar (XLM) broke out of the immediate overhead resistance of $0.064886 on Oct.14 but the bulls could not build on the gains. The price quickly turned around on Oct. 15, which shows a lack of demand at higher levels.
Currently, the bulls are attempting to defend the support at the moving averages. If successful, a move to the downtrend line is likely. A breakout of this resistance could propel the price to $0.088708. Therefore, traders can hold their long positions with stops at $0.051.
Contrary to our assumption, if the XLM/USD pair dips below the moving averages it can retest the support at $0.051014.
TRX/USD
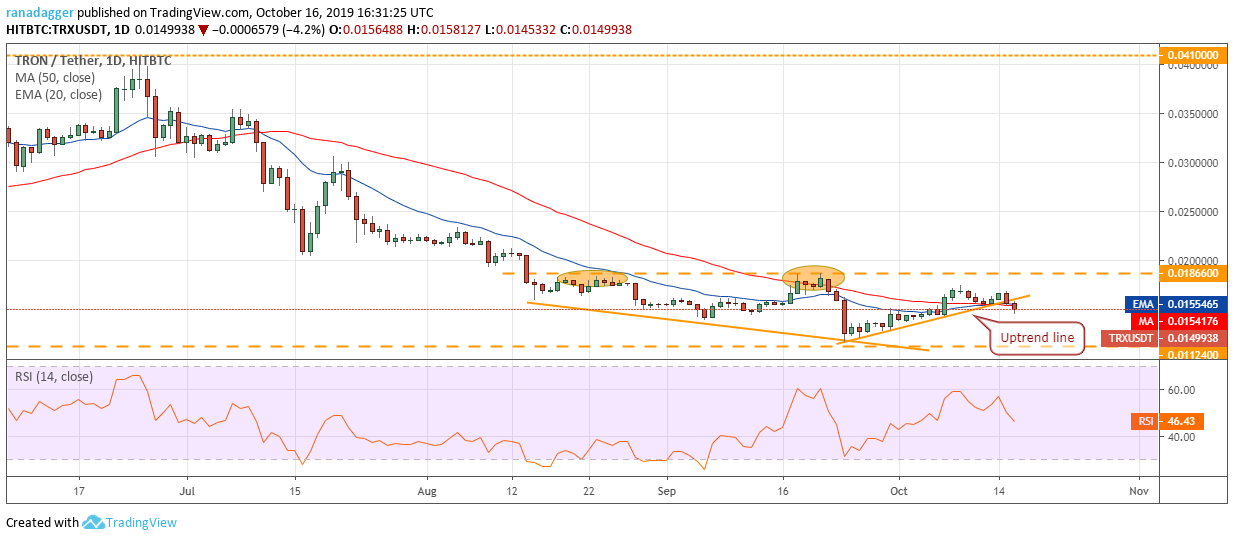
The bounce off the moving averages was short-lived as Tron (TRX) turned down on Oct. 15 and broke below the uptrend line. This shows selling pressure at higher levels. If the bears sustain the price below the moving averages, a drop to $0.0136 and below that to $0.01124 is possible.
However, if the bulls reclaim the moving averages quickly, we anticipate another attempt to push the TRX/USD pair to the overhead resistance of $0.01866. This is an important level to watch out for because it has been a major barrier during previous pullback attempts.
If the bulls can propel the price above $0.01866, the pair can start a move back to $0.041, with an intermediate resistance at $0.030. Therefore, we retain the buy recommendation given in an earlier analysis.
The views and opinions expressed here are solely those of the author and do not necessarily reflect the views of CryptoX. Every investment and trading move involves risk. You should conduct your own research when making a decision.
Market data is provided by HitBTC exchange.


