On-chain data shows whale ratio has exceeded the 0.50 mark, historically a sign that whales are dumping in the short term.
Bitcoin Whales Have Started Selling Their Coins
As pointed out by a CryptoQuant post, the Bitcoin whale ratio has started going up above the 0.50 level. This signal has usually meant a bearish outlook for the crypto in the short term.
The BTC all exchanges whale ratio is an indicator that gives an estimation of how many whales are sending their coins to exchanges.
The metric does so by taking the sum of the top 10 transactions to each exchange and dividing it with the total inflow on all exchanges.
Exchange Whale Ratio= Sum of Top 10 Exchange Inflow TXs (BTC) ÷ Total Exchange Inflows in BTC
The “inflow” is another indicator, it gives the total amount of Bitcoin entering into exchange wallets from personal ones.
When the whale ratio rises, it means the top 10 transactions to exchanges are taking up a larger part of the total BTC going into these exchanges.
This means more whales have started sending their coins to exchanges, either for withdrawing to fiat or stablecoins, or for purchasing altcoins.
On the other hand, when the value moves down, it means the general small transactions make up the majority of the inflows to exchanges, and that Bitcoin whales aren’t moving their coins around at this time.
Related Reading | Could A Bitcoin Bull Flag Leave Bears Blindsided
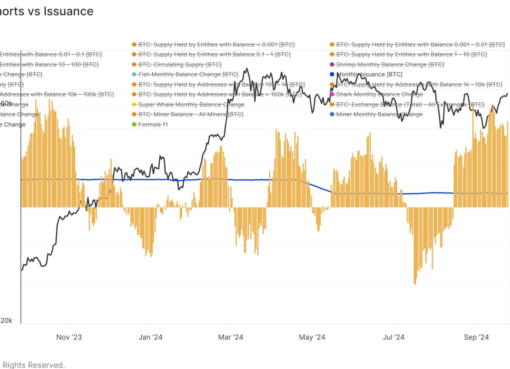
Here is a chart showing the trend in the value of the indicator over the past year:
The Bitcoin whale ratio has once again started climbing up | Source: CryptoQuant
As the above graph shows, the whale ratio has soared many times in the past year, and whenever it has, a crash in the price of the coin has also followed shortly after.
Related Reading | JPMorgan Analysts Say That Big Money Are Dumping Bitcoin For Ethereum
Looks like the whale ratio has once again started to move up as its value now crosses 0.50. This could indicate that BTC might move down next in the short term at least.
BTC Price
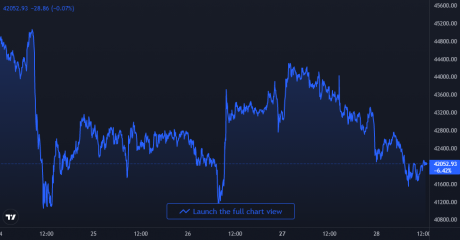
At the time of writing, Bitcoin’s price floats around $42k, down 3% in the last seven days. Over the last month, the crypto has lost 13% in value.
The below chart shows the trend in the price of the coin over the last five days:
BTC's price seems to have crashed down once again | Source: BTCUSD on TradingView
After showing some recovery from the crash due to news about China’s ban, Bitcoin has once again crashed down back to $42k after going up near $44.5k.
If the whale ratio is anything to go by, the price might continue to move further down in the short term. Maintaining above $40k is going to be crucial for any big moves forward.


