

Litecoin price is struggling to gain pace above $66.40 against the US Dollar. LTC could revisit the $60 support before the bulls take a strong stand.
- Litecoin is correcting losses from the $63 support zone against the US Dollar.
- The price is now trading below $66 and the 100 simple moving average (4 hours).
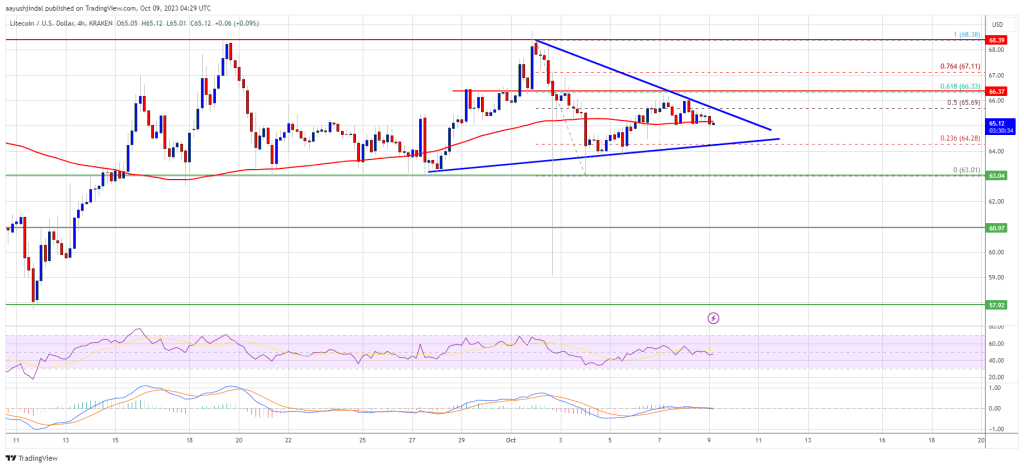
- There is a key contracting triangle forming with resistance near $65.50 on the 4-hour chart of the LTC/USD pair (data feed from Kraken).
- The price could drop toward the $60 support before it starts a fresh increase.
Litecoin Price Signals Bearish Move
This past week, there was a fresh decline in Bitcoin, Ethereum, Litecoin, and other altcoins against the US Dollar. LTC price formed a top near $68.40 before it started a fresh decline.
The price traded below the $66.40 and $65.00 support levels. It retested the $63.00 support zone. A low was formed near $63.01 and the price is now attempting a fresh increase. There was a move above the $65.20 resistance.
The price spiked above the 50% Fib retracement level of the downward move from the $68.38 swing high to the $63.01 low. Litecoin is now trading below $66 and the 100 simple moving average (4 hours). There is also a key contracting triangle forming with resistance near $65.50 on the 4-hour chart of the LTC/USD pair.
On the upside, immediate resistance is near the $65.50 zone. The next major resistance is near the $6.40 level. It is close to the 61.8% Fib retracement level of the downward move from the $68.38 swing high to the $63.01 low. If there is a clear break above the $66.40 resistance, the price could start another strong increase.
Source: LTCUSD on TradingView.com
In the stated case, the price is likely to continue higher toward the $68.40 and $70 levels. Any more gains might send LTC’s price toward the $75 resistance zone.
Downside Thrust in LTC?
If Litecoin price fails to clear the $66.40 resistance level, there could be a fresh decline. Initial support on the downside is near the $63.00 level.
The next major support is forming near the $60 level, below which there is a risk of a move toward the $58.00 support. Any further losses may perhaps send the price toward the $55 support.
Technical indicators:
4-hour MACD – The MACD is now losing pace in the bullish zone.
4-hour RSI (Relative Strength Index) – The RSI for LTC/USD is still below the 50 level.
Major Support Levels – $63.00 followed by $60.00.
Major Resistance Levels – $66.40 and $68.40.


