Trading altcoins continues to be one of the most profitable strategies in the crypto market. The highlight of this week was the MATIC (MATIC) pump and subsequent dump, which I was lucky enough to time perfectly, securing a 60% profit near the all-time high. I closed a number of positions in profit, and am still trading EtherParty (FUEL), (IOST), Elrond (ERD), Chainlink (LINK), Zilliqa (ZIL), Verge (XVG) and FunFair (FUN).
I failed to take profits on some of these coins at the first resistance and target, only to see them retrace to my entry and this presents an important lesson about being too greedy. Each setup looked good, but the MATIC movement spooked the market and caused a ripple effect that saw temporary price depreciation across the board. Lesson learned.
BTC/USD update
Bitcoin (BTC) has been chopping sideways with errant wicks both up and down throughout the past week, likely liquidating high leverage traders on both sides. I am presently long Bitcoin from $7,100 after taking two other positions that closed even or in a slight profit this week.
BTC USD hourly chart. Source: TradingView
The first signal that sparked my interest in a long position was a clear bullish divergence with the Relative Strength Index (RSI) on the hourly chart. I normally do not trade lower time frames, but I noticed that there were potential divergences showing on larger time frames, so I zoomed in. Often we will see an hourly bull divergence confirm on the 4-hour, 6-hour and daily timeframes.
BTC USD 4-hour chart. Source: TradingView
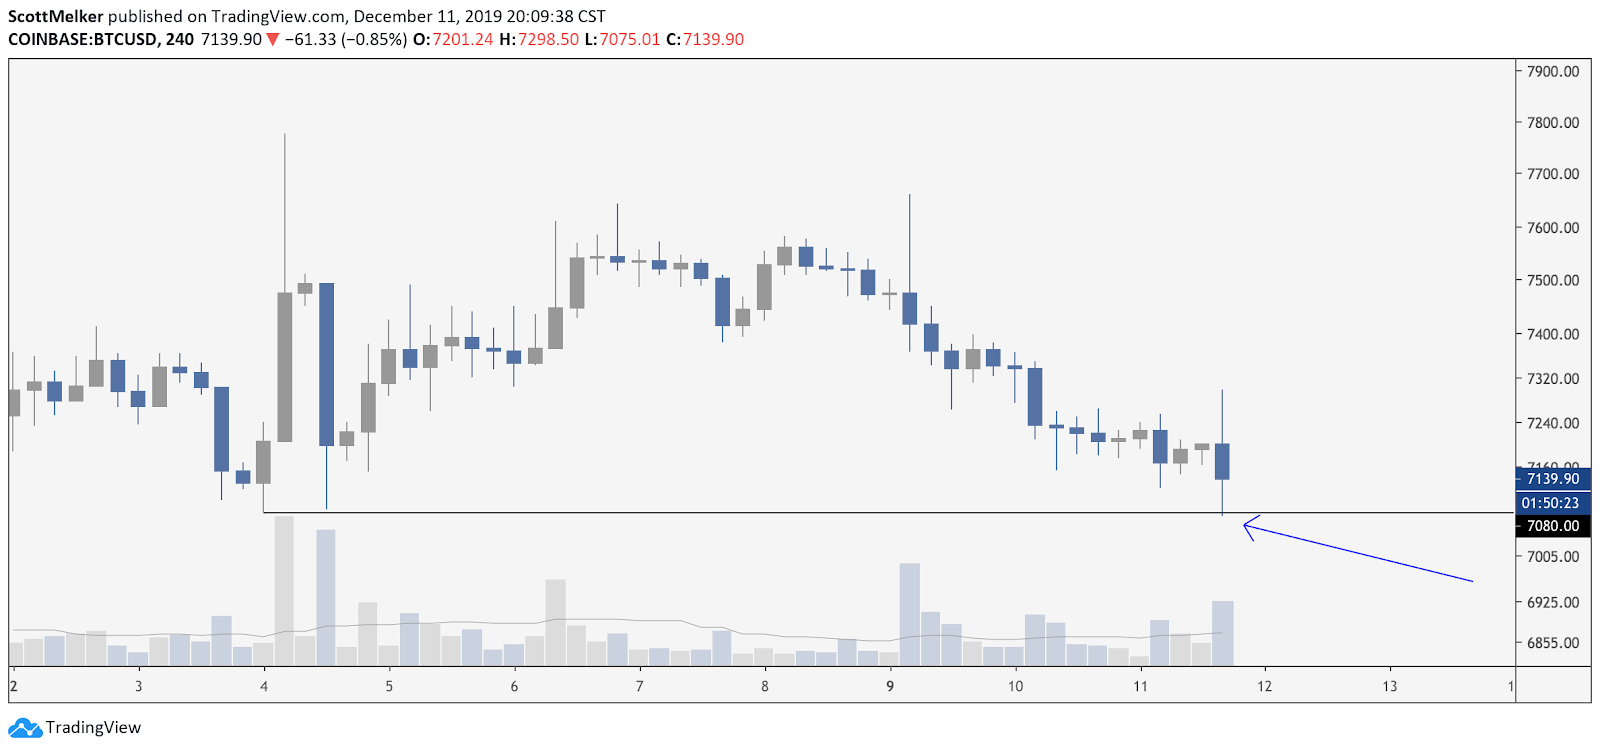
I decided to enter a position at $7,100 when the price dropped down to the previous swing low at $7,080 and then bounced. This looked likely to confirm as a bullish swing failure pattern (SFP). At the most basic level, when price wicks slightly below a previous swing low, it’s an indication that liquidity has been engineered by a whale.
In this case, it seemed likely that they pushed price down to compel retailer traders to take shorts, and also to fire existing stop losses on long positions – thus creating a ton of sell orders to buy into. The price has currently risen from that point.
BTC USD 4-hour chart. Source: TradingView
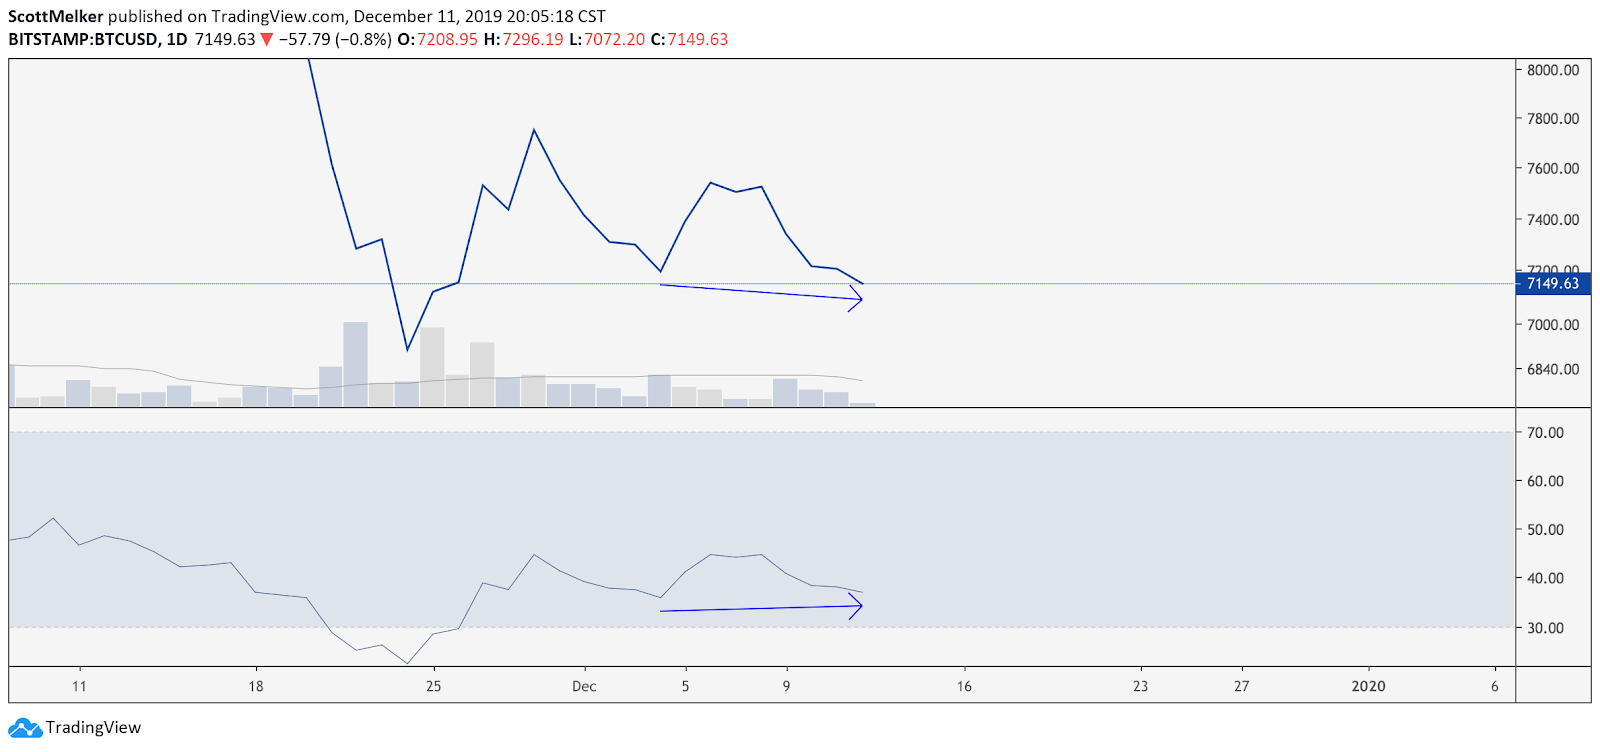
Furthermore, the price is showing a potential bullish divergence with the RSI on the daily chart, which would be a likely signal of a bottom. I am awaiting confirmation, as this would make me feel far more secure in my current position.
FUN/BTC
Trade idea
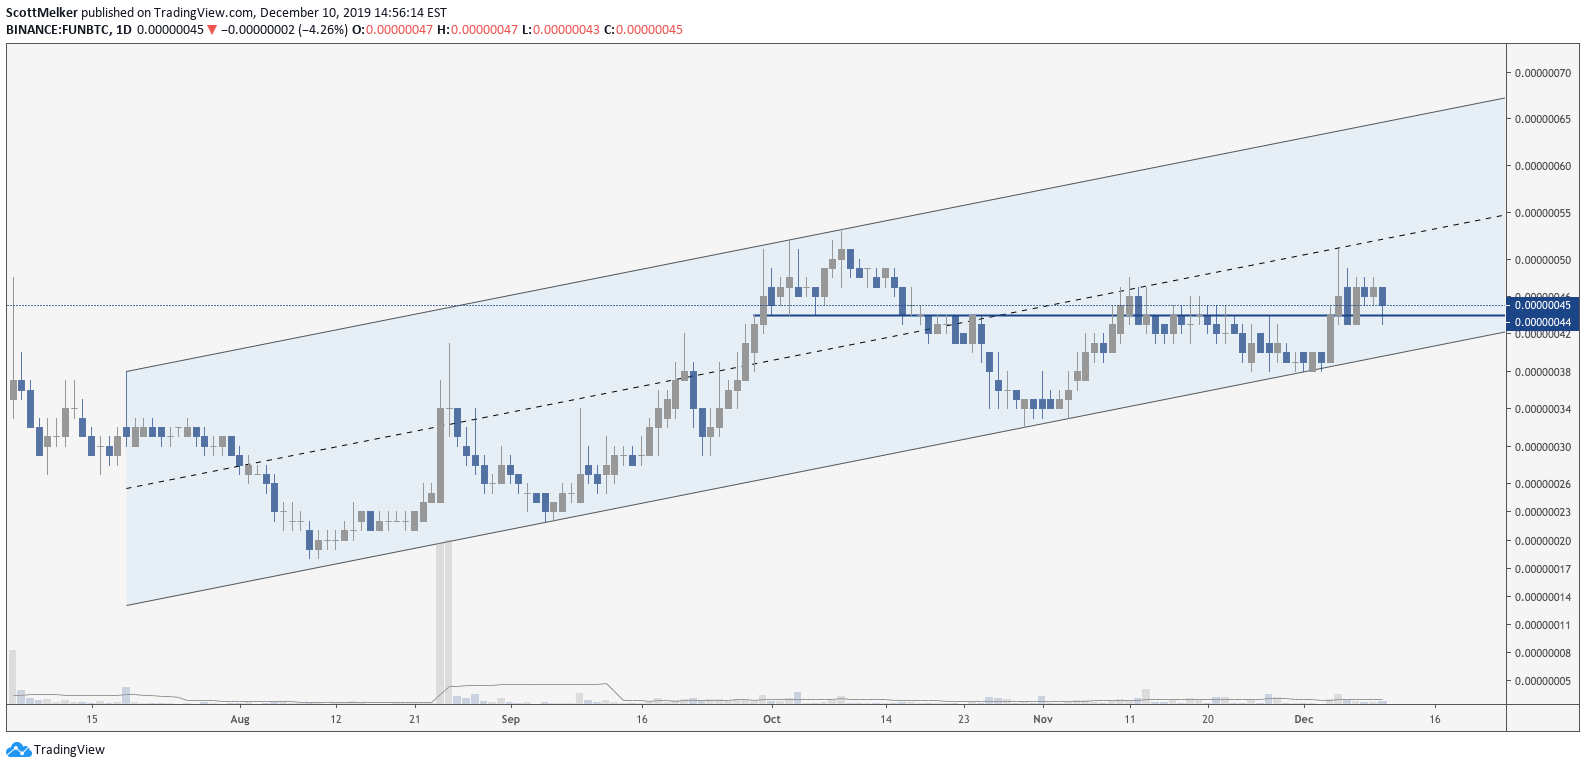
FUN offered a very clear trading opportunity this week. I pulled up the chart after not looking at it for almost two months and found that price had continued traveling in a channel that I drew in October near the local highs.
FUN BTC daily chart. Source: TradingView
The ideal entry would have been a bounce off of the channel bottom, between .00000033 (sats) and .00000038 (sats). However, a clear resistance formed at .00000044 (sats), which flipped to support and was my entry, as shown below.
How it worked out
The price moved up very quickly, topping out at .00000060 (sats). I exited half of my position at .00000056 (sats), for a quick profit of 27%. The rest of the position is still open and my target is at the top of the channel.
IOST/BTC
Trade idea
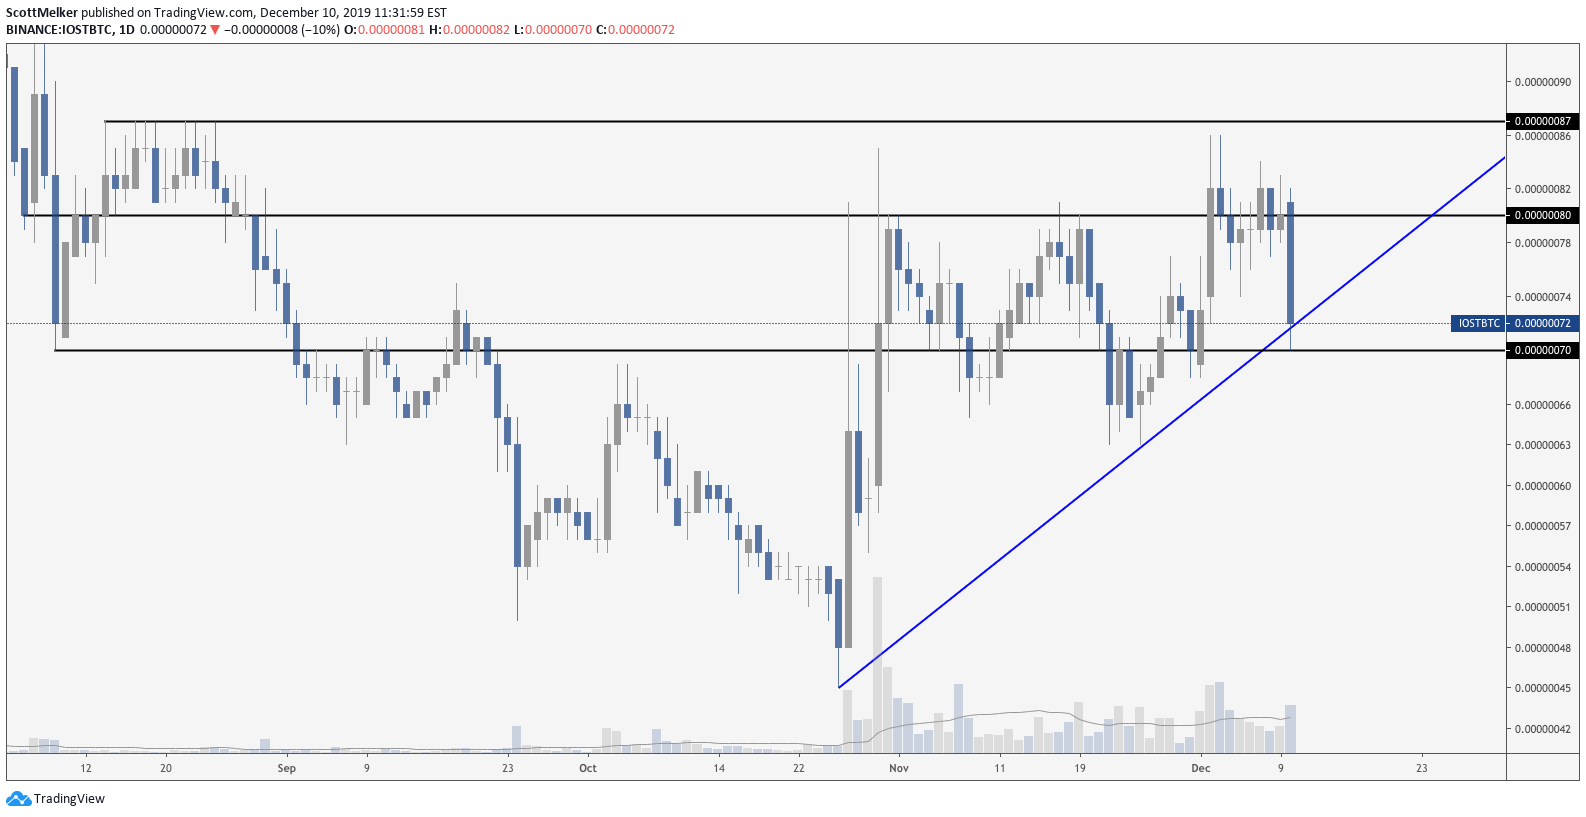
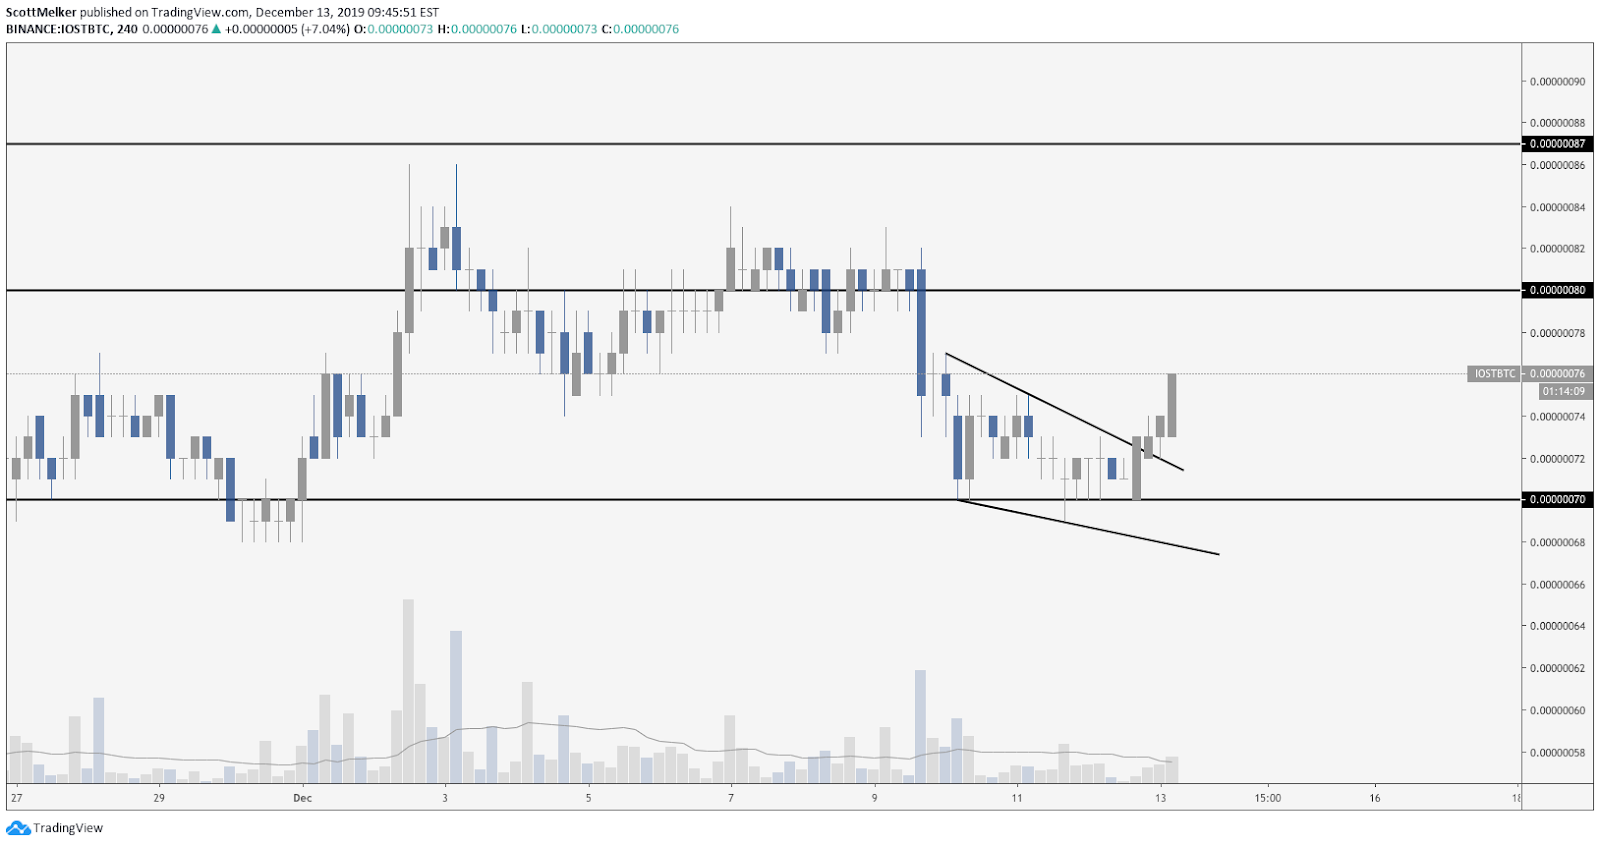
This is a relatively straightforward trade. The price was forming a pennant at support (not shown) before the Binance shakeup. The MATIC move caused the price to drop through support at .00000080 (sats). I was watching for a bounce off of the blue ascending support but saw price quickly drop through and entered at .00000071 (sats) just above the horizontal support line.
IOST BTC daily chart. Source: TradingView
I want little to do with IOST below that line, or below the .00000070 (sats) support and I have set my stop loss at .00000067 (sats) because this would allow for a wick below that .00000070 (sats) support and close back above.
How it worked out
IOST BTC 4-hour chart. Source: TradingView
This trade is currently still open and starting to move as anticipated. After my entry, the price continued to test the .00000070 (sats) support, dropping below by 1 sat but never reaching my stop loss. The price then formed a descending wedge, where it is currently breaking up from. Initial targets are shown as black horizontal lines.
The views and opinions expressed here are solely those of the (@scottmelker) and do not necessarily reflect the views of CryptoX. Every investment and trading move involves risk. You should conduct your own research when making a decision.


