After plunging last week, the Bitcoin market has mounted a hefty recovery over the past week. The leading crypto asset traded as high as $9,700 on Saturday evening — just a few percentage points shy of the monthly high.
Ethereum has fared even better, with the asset pushing 10% higher within a 24-hour time period this weekend.
This recovery has convinced many traders that the crypto market is on the verge of a full-fledged bull run, but a key indicator is suggesting a “perfect sell setup” has formed.
Bitcoin & Top Altcoins Form “Perfect Sell Setup”
One prominent trader recently shared the image below, showing that top cryptocurrencies such as Bitcoin, Ethereum, and Chainlink are printing “perfect sell setups.”
“Even though some of [the assets are] on perfected sell setups, most [will see] new weekly highs, but TD says 80% of the market is toppy by next week! The list is long — I can’t fit them all in one chart,” said the analyst that shared these charts.
Charts of top cryptocurrencies, including Bitcoin, Ethereum, and Chainlink, from crypto trader “Moe” (@Moe_Mentum_ on Twitter).
The sell setups are shown by the fact that all the assets in the image are printing a Tom Demark Sequential “8” candle, often seen just before or at a trend’s high. The Tom Demark Sequential is a time-based indicator that forms “8,” “9,” and “13” candles when an asset is near an inflection point in its trend.
Adding to the bearish sentiment, Bitcoin and other top cryptocurrencies are forming this “perfect sell setup” right below crucial levels of resistance.
For BTC, in particular, this is important.
Bitcoin is currently sitting at $9,500, just a few hundred dollars below the crucial $10,000-10,500 resistance.
It seeing a rejection here could spell disaster for bulls because that would mean BTC has formed a lower high on a macro timeframe. Consecutive lower highs, as seen over the past year, are suggestive of a macro downtrend.
The Fundamentals Are Still in BTC’s Favor
The fundamentals still lean in favors of bulls though, despite the bearish technical analysis depicted above.
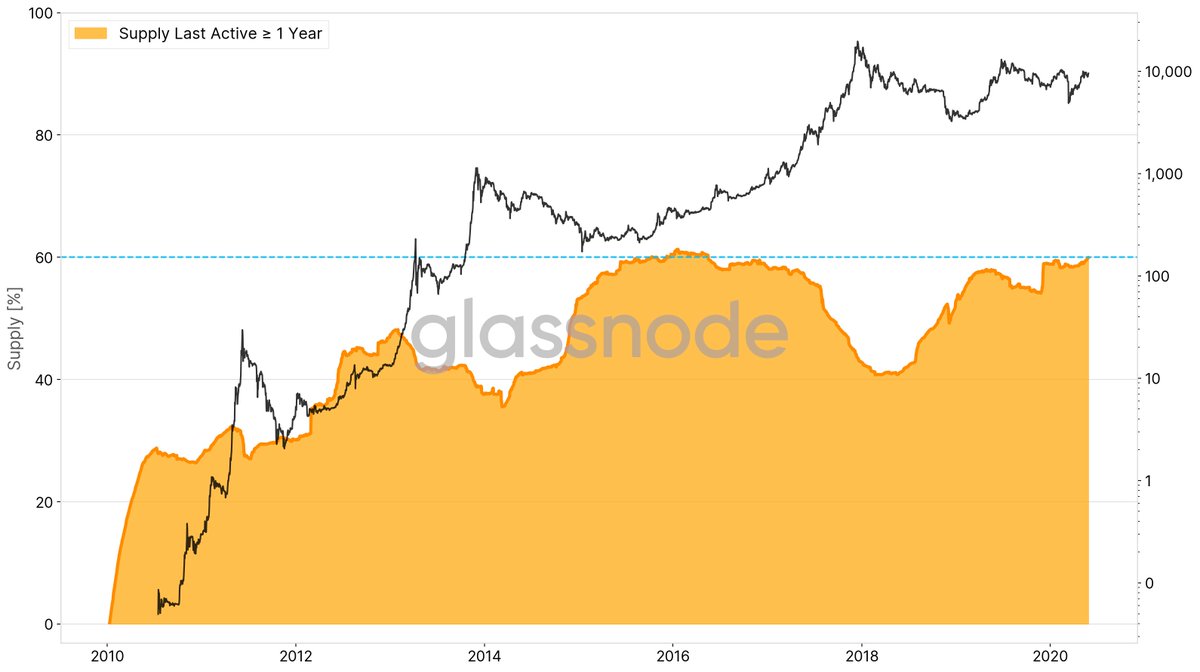
Blockchain analytics firm Glassnode recently found that around 60% of the ~19 million BTC in circulation “hasn’t moved in over a year, showing increased investor HODLing behavior.”
The last time this much of BTC (percentage-wise) was “frozen” so to say was “right before the BTC bull market of 2017,” prior to the 2,000% rally that took Bitcoin from $1,000 to $20,000.

Chart of Bitcoin investor habits from crypto analytics firm Glassnode (@Glassnode on Twitter). The image was shared on May 29th, 2020.
Adding to this, the Chinese yuan has continued to slide against the U.S. dollar on expectations of sanctions and backlash.
The backlash comes after the mainland Chinese government began a process to impose a new security law on Hong Kong.
Featured Image from Shutterstock


