

Is the Bitcoin Price Leaving the Bears Behind?
September 16, 2019 by Ramiro Burgos
At last, the bitcoin price has started to leave its bearish channel influence behind. Recently it has consolidated above the $10,000 USD level as a new market reference, while a long term formation takes place. That’s the latest view in our weekly technical analysis — read on to find out more.
Also read: Bitcoin Price Sideways Market Stretches on… What Will Change It?
Subscribe to the Bitsonline YouTube channel for great videos featuring industry insiders & experts
Bitcoin Price Technical Analysis
Long-Term Analysis
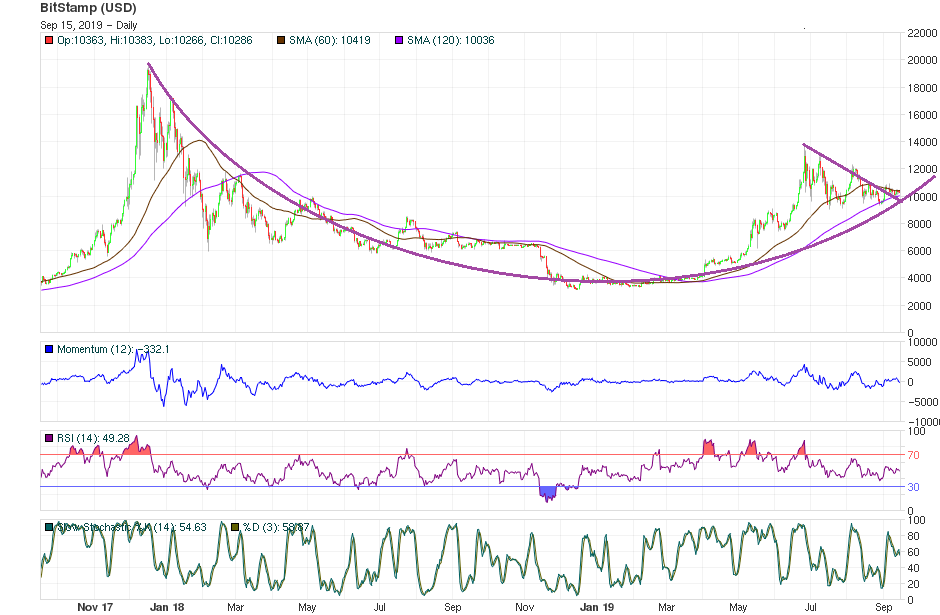
The bitcoin price is still keeping to a sideways lateral market around $10,000, walking away from bearish channel influence. Meanwhile, a bullish consensus gains strength. The high exposure to external factors spreads the general will, and offer and demand seem to be balanced around this new reference. This creates a 3,000 basis point scenario, which recognizes $9,000 as a support and a target near $12,000.
Mass Psychology Analysis reflects that a Hope phase is active, prompting the general public to request information and opinions about cryptocurrencies from institutional investors, who then raise the topic for consideration via mass media.
Mid-Term Analysis
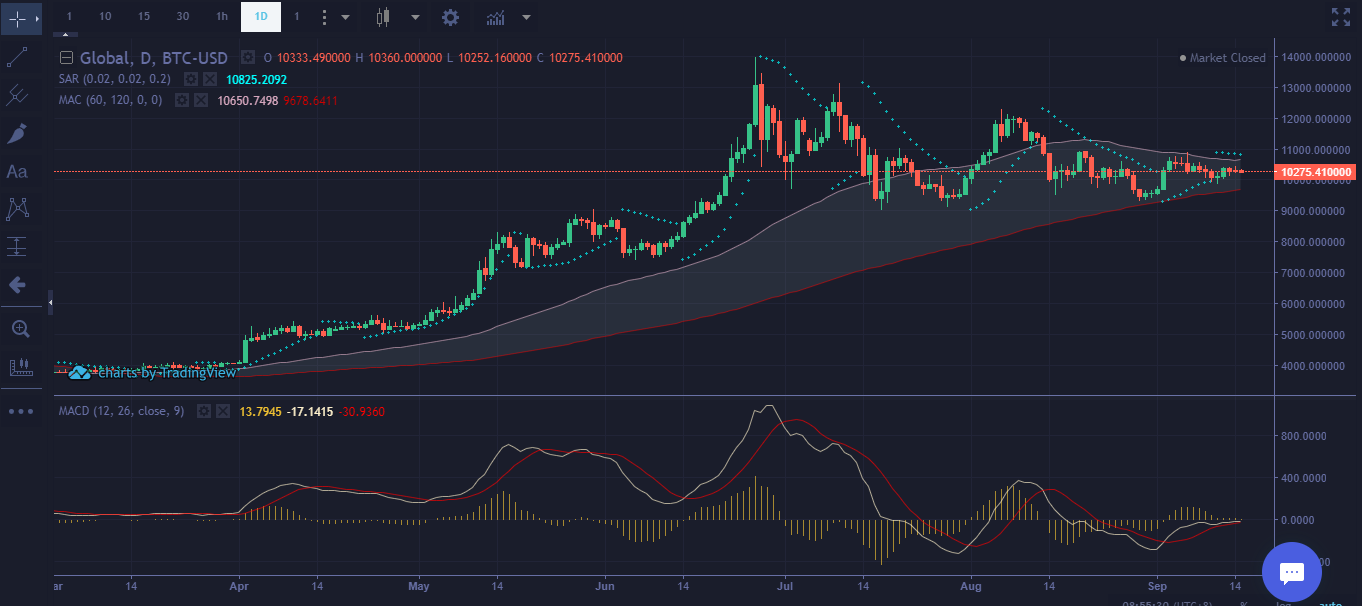
Mathematical Indicators have started to bring positive signals, but they’re also still failing to stimulate the trend enough to go up steadily. However the lateral development structure around $10,000 seems to be strong, and the current erratic general will stays balanced among contradictory News and external factors.
The target to the up side should coincide with a big triangle pattern near $15,000, or near $6,000 if it breaks to the down side. But if the lateral market keeps developing, a long-term Rounded Bottom formation could take place favoring the upward chance.
Short-Term Analysis
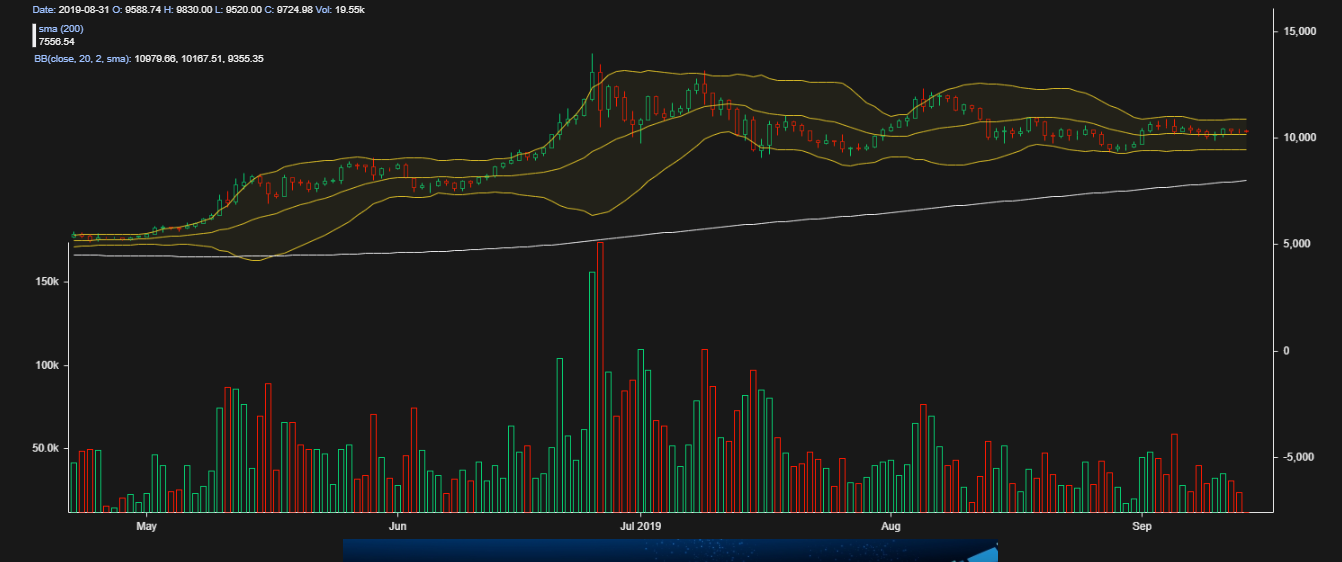
Bollinger Bands Analysis still looks neutral, reflecting prices over the center line, but without stamina to go higher.
After breaking the channel’s upper bound by sustaining that $10,000 lateral development, Japanese Fairy examples reflect that the current battlefield among demand’s Soldiers and offer’s Crows is confirmed between $9,000 and $12,000. This could stay active for another month, while external factors clarify the frame background of institutional investors’ role… or some News arrives to define the trend.
What do you think will happen to the bitcoin price? Share your predictions in the comments below.
If you find Ramiro’s analyses interesting or helpful, you can find out more about how he comes to his conclusions by checking out his primer book, the Manual de Análisis Técnico Aplicado a los Mercados Bursátiles. The text covers the whole range of technical analysis concepts, from introductory to advanced and everything in between. To order, send an email to [email protected]

Images via Pixabay, Ramiro Burgos
This technical analysis is meant for informational purposes only. Bitsonline is not responsible for any gains or losses incurred while trading bitcoin.


