

Bitcoin price is holding gains above the $52,000 resistance. BTC is consolidating gains and might aim for more upsides toward the $55,000 resistance.
- Bitcoin price is showing positive signs below the $52,800 resistance zone.
- The price is trading above $51,500 and the 100 hourly Simple moving average.
- There is a connecting bullish trend line forming with support at $51,500 on the hourly chart of the BTC/USD pair (data feed from Kraken).
- The pair could continue to move up if it clears the $52,800 resistance zone.
Bitcoin Price Eyes More Upsides
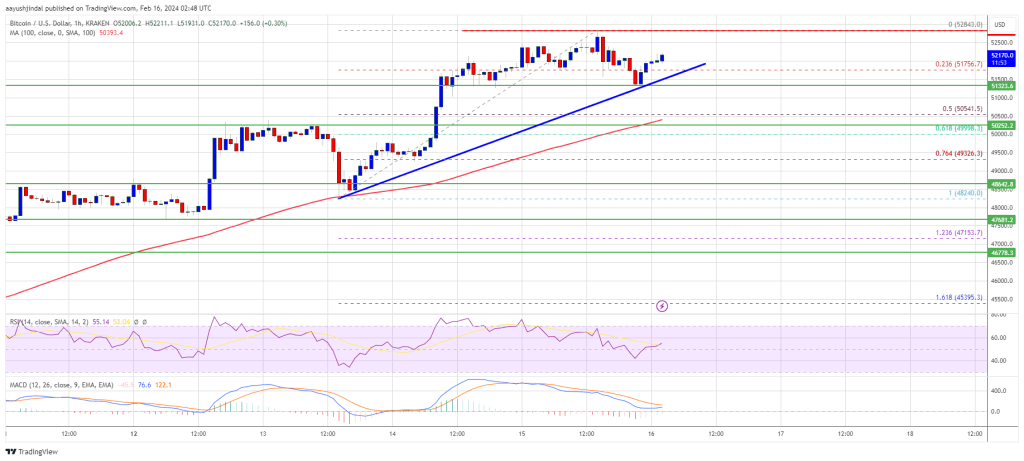
Bitcoin price gained pace above the $51,200 resistance zone. BTC even broke the $52,000 resistance zone. A new multi-week high was formed near $52,843 and the price is now consolidating gains.
There was a minor decline below the $52,000 level. The price dipped below the 23.6% Fib retracement level of the upward move from the $48,240 swing low to the $52,843 high. However, the bulls were active above the $51,200 support zone.
Bitcoin is now trading above $51,500 and the 100 hourly Simple moving average. There is also a connecting bullish trend line forming with support at $51,500 on the hourly chart of the BTC/USD pair.
Source: BTCUSD on TradingView.com
Immediate resistance is near the $52,500 level. The next key resistance could be $52,800, above which the price could extend its rally. The next stop for the bulls may perhaps be $53,200. A clear move above the $53,200 resistance could send the price toward the $54,000 resistance. The next resistance could be near the $55,000 level.
Are Dips Supported In BTC?
If Bitcoin fails to rise above the $52,800 resistance zone, it could start another downside correction in the near term. Immediate support on the downside is near the $51,500 level and the trend line.
The first major support is $50,550 and the 50% Fib retracement level of the upward move from the $48,240 swing low to the $52,843 high. If there is a close below $50,500, the price could gain bearish momentum. In the stated case, the price could dive toward the $48,500 support zone.
Technical indicators:
Hourly MACD – The MACD is now gaining pace in the bullish zone.
Hourly RSI (Relative Strength Index) – The RSI for BTC/USD is now above the 50 level.
Major Support Levels – $51,500, followed by $50,500.
Major Resistance Levels – $52,500, $52,800, and $54,000.
Disclaimer: The article is provided for educational purposes only. It does not represent the opinions of NewsBTC on whether to buy, sell or hold any investments and naturally investing carries risks. You are advised to conduct your own research before making any investment decisions. Use information provided on this website entirely at your own risk.

 Consolidating Gains: Here’s What Could Trigger Another Rally")
