

Ethereum is showing signs of an upside correction from the $176 low against the US Dollar. However, ETH price is likely to face a major resistance near $195 and the 100 hourly SMA.
- Ethereum extended its decline and traded to a new weekly low at $176.
- The price is currently recovering and showing positive signs above $185.
- There is a major declining channel forming with resistance near $189 on the hourly chart of ETH/USD (data feed via Kraken).
- The bulls are likely to struggle and face a strong barrier near $195 and $198.
Ethereum Price is Facing Hurdles
After testing the $180 level, Ethereum made a recovery attempt above $185 against the US Dollar. ETH price climbed above the $188 resistance, but it struggled to surpass the $190 pivot level.
As a result, there was a fresh decline and the price broke the $180 low. A new weekly low was formed near $176 and the price is again correcting higher. It climbed above the 23.6% Fib retracement level of the key decline from the $214 high to $176 low.
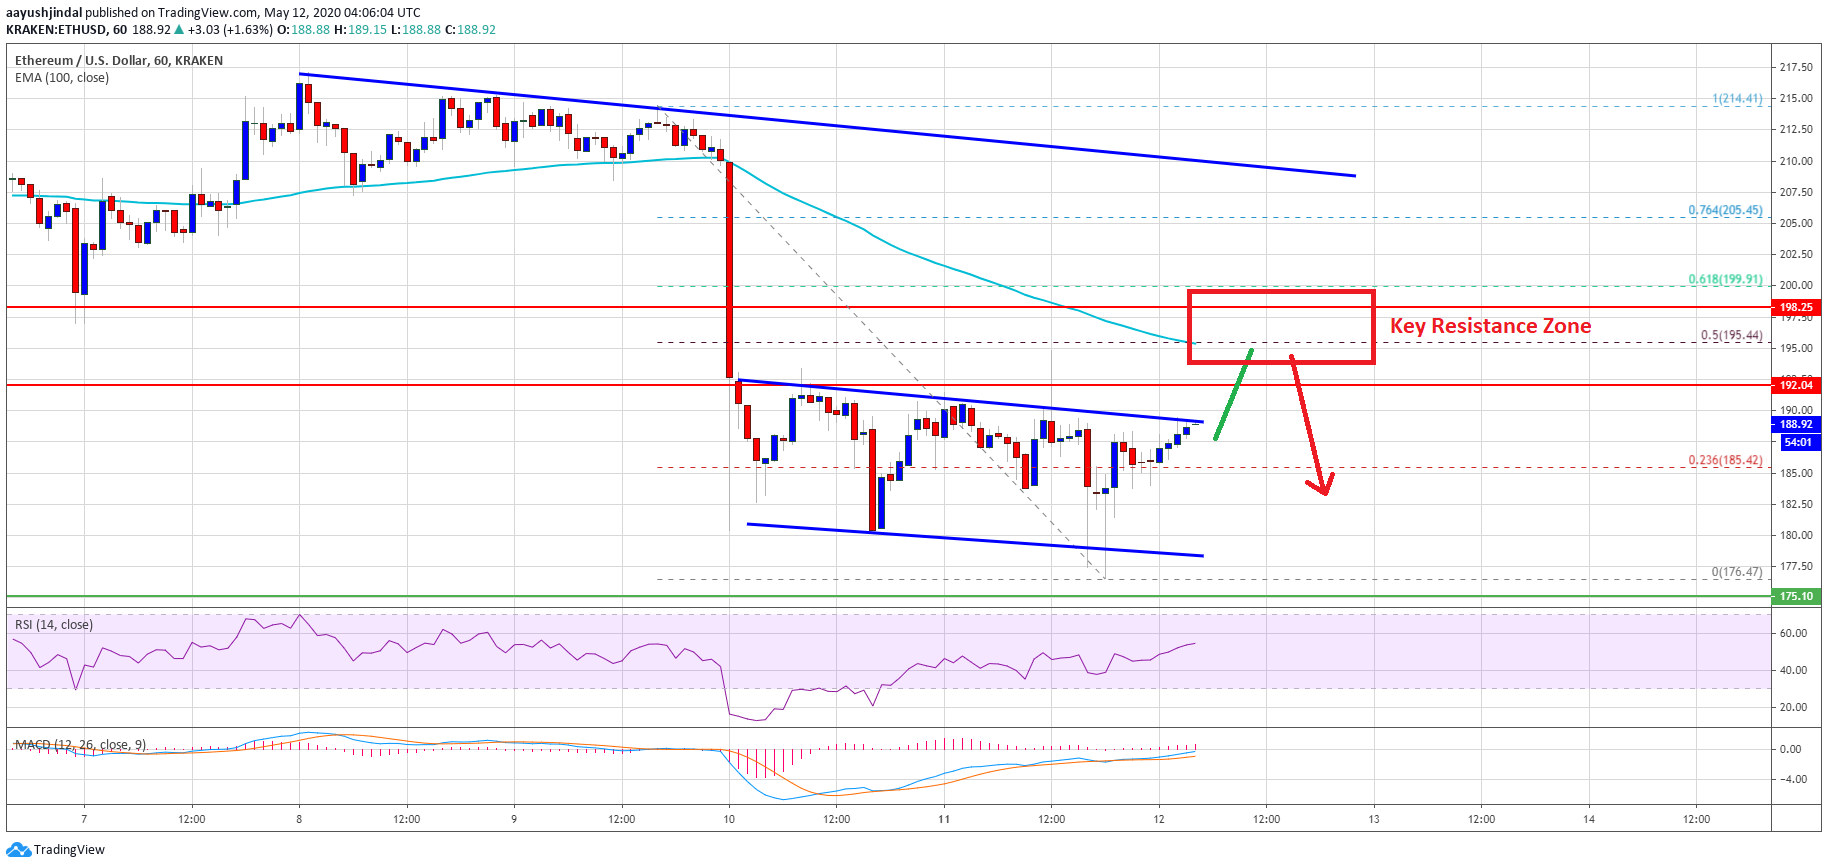
Ethereum is now approaching the $190 resistance zone. There is also a major declining channel forming with resistance near $189 on the hourly chart of ETH/USD. If there is a clear break above the channel resistance and $190, the price could continue to recover.
On the upside, there is a major resistance forming near the $195 level and the 100 hourly simple moving average. The 50% Fib retracement level of the key decline from the $214 high to $176 low is also near $195.
To start a decent upward move and a fresh bullish wave, ether price must surpass $195, 100 hourly SMA, and the $198 pivot level. A successful close above $198 will most likely open the doors for a push above the $200 and $202 resistance levels in the near term.
Bearish Continuation
If Ethereum fails to climb above the $190 and $195 resistance levels, it is likely to resume its decline. An immediate support is near the channel lower trend line at $177.
The key supports are near $176 and $175, below which the price could accelerate its drop towards the $165 level in the coming sessions.
Technical Indicators
Hourly MACD – The MACD for ETH/USD is currently moving in the bullish zone.
Hourly RSI – The RSI for ETH/USD is struggling to stay above the 50 level.
Major Support Level – $175
Major Resistance Level – $195
Take advantage of the trading opportunities with Plus500
Risk disclaimer: 76.4% of retail CFD accounts lose money.


