

Ethereum is holding the main $200 and $198 support levels against the US Dollar. ETH price is currently testing the 100 hourly SMA and struggling to continue higher above $205.
- Ethereum is facing a strong resistance near the $205 level and the 100 hourly SMA.
- The price is likely to accelerate higher if it breaks the $205 resistance zone.
- There was a break above a key bearish trend line with resistance near $202 on the hourly chart of ETH/USD (data feed via Kraken).
- The pair might decline again towards $200 or $198 if it fails near the 100 hourly SMA.
Ethereum Price Testing 100 Hourly SMA
Ethereum price declined again below the $200 support zone. ETH price even spiked below the $198 support and settled below the 100 hourly simple moving average.
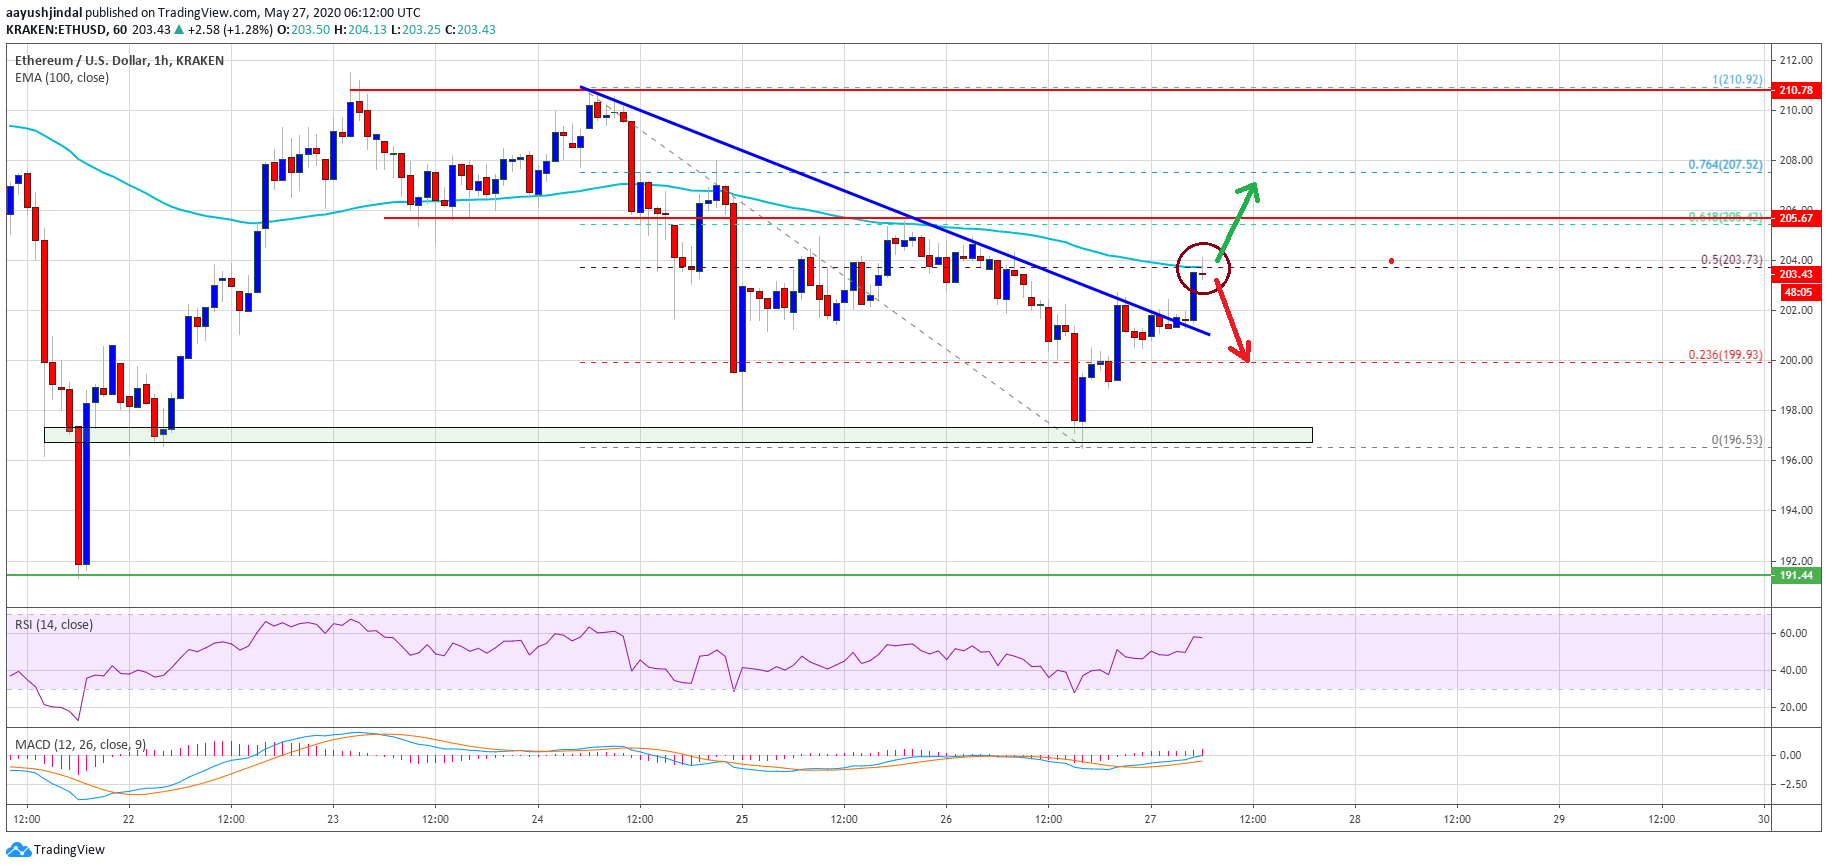
However, the decline was limited and the price found support near $196. It is currently rising and trading above the $200 pivot level. There was a break above the 23.6% Fib retracement level of the key decline from the $211 high to $196 low.
More importantly, there was a break above a key bearish trend line with resistance near $202 on the hourly chart of ETH/USD. Ether is now trading near a major hurdle at $204 and the 100 hourly simple moving average.
The 50% Fib retracement level of the key decline from the $211 high to $196 low is also acting as a resistance. If Ethereum gains pace above the 100 hourly SMA and clears the $205 resistance, there are chances of a sustained upward move in the coming sessions.
The next major resistance is near the $210 level (an inflection zone). A clear break above the $210 resistance could open the doors for a sharp rise in the coming sessions in the near term.
Another Rejection?
If Ethereum struggles to gain pace above the 100 hourly SMA and the $205 resistance, it could start a fresh decline. The main support zone is near the $198 level.
If there is a successful daily close below the $198 level could open the doors for a larger decline. The next key support is near the $192 level, below which it could slide towards the $180 zone.
Technical Indicators
Hourly MACD – The MACD for ETH/USD is currently gaining momentum in the bullish zone.
Hourly RSI – The RSI for ETH/USD is now rising and it is well above the 50 level.
Major Support Level – $198
Major Resistance Level – $205
Take advantage of the trading opportunities with Plus500
Risk disclaimer: 76.4% of retail CFD accounts lose money.


