The past week has been an emotional rollercoaster for Ether (ETH) traders, as there were seven four-hour candles of a 10% or larger price movement.
Furthermore, the most recent 30% drop to $920 triggered $550 million in liquidations on long futures contracts. To complicate things even further, this current price correction is taking place just four weeks ahead of the launch of CME’s ETH futures.
It’s possible that even the most bullish Ether traders did not expect an 85% rally to occur in just eight days. During that short timespan, the top-ranked altcoin blasted through the $800 resistance and quickly climbed to $1,350, which is only 5% below its all-time high.
In 2017, Ether’s swift climb to $1,400 was primarily backed by the initial coin offering boom, but this time a different set of factors drove Ether’s price higher. Many DeFi platforms rely on the Ethereum network, and Ether is the most common asset used as the gateway to these platforms. Aside from increased activity on the Ethereum network, the increased use has also resulted in high transaction fees.
At the moment, there is not much negative news flow coming from the Ethereum camp or major media outlets. Data shows that Ether’s fundamentals are still strong, and investors are content to wait for further Eth2 network developments.
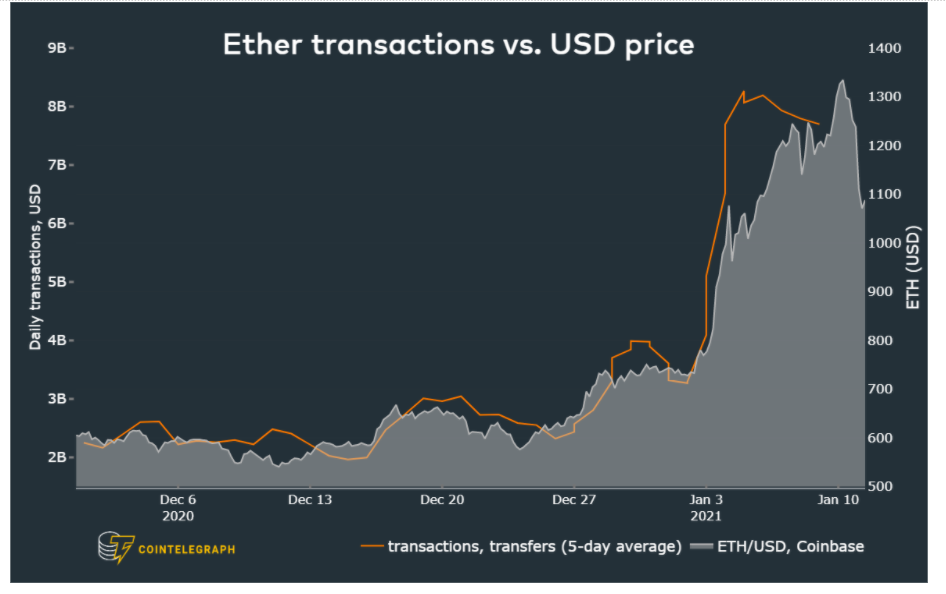
To understand whether the recent crash reflects a potential local top, investors should gauge the network use metrics on the Ethereum network. A great place to start is analyzing transactions and transfer value.

The chart above shows the indicator spiking above $8 billion in daily transactions, a 200% increase compared with the previous month’s $2.6 billion average. This noticeable hike in transaction and transfer value signals strength and suggests that Ether’s price is sustainable above $1,000.
Exchange withdrawals point to whale accumulation
Increasing withdrawals from exchanges can be caused by multiple factors, including staking, yield farming and buyers sending coins to cold storage. Usually, a steady flow of net deposits indicates a willingness to sell in the shortterm. On the other hand, net withdrawals are generally related to periods of whale accumulation.

From Jan. 4 to Jan. 11, exchanges faced net withdrawals of 460,000 ETH. This move signals a potential accumulation from whales either transferring to cold wallets or putting these coins into the DeFi ecosystem.
This move contradicts the usual expectation that large holders rush to deposit on exchanges as Ether approaches its all-time high. Apart from a 100,000 ETH net deposit on Jan. 10, the net withdrawal trend has prevailed since December 2020.
The futures premium is still unusually high
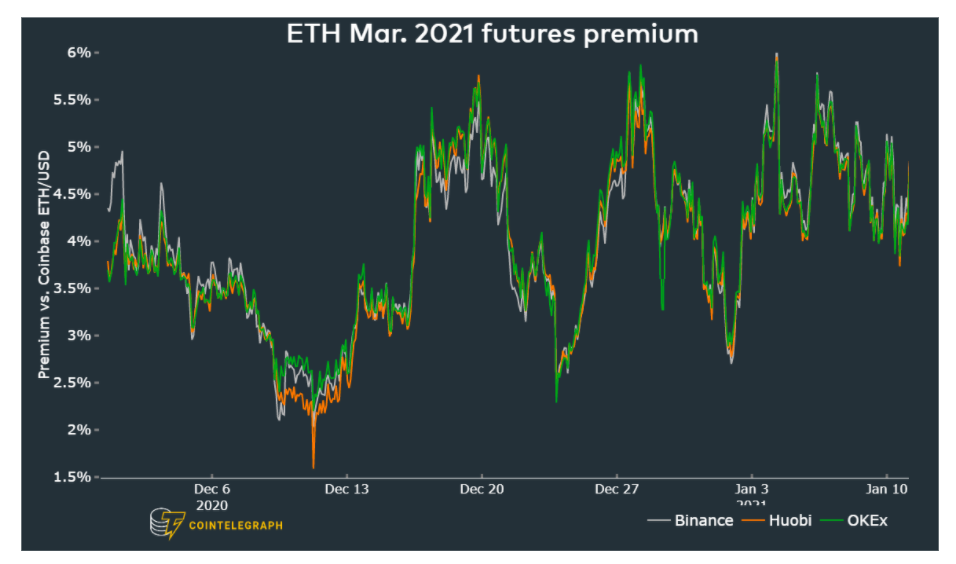
Professional traders tend to dominate longer-term futures contracts with set expiry dates. By measuring the expense gap between futures and the regular spot market, a trader can gauge the level of bullishness in the market.
The three-month futures should usually trade with a 1.5% or higher premium versus regular spot exchanges. Whenever this indicator fades or turns negative, this is an alarming red flag. This situation is known as backwardation and indicates that the market is turning bearish.

The above chart shows that the indicator has been ranging from 3.5% to 6%, which translates as moderately bullish. The current 4.5% rate is equal to a 19% annualized premium and is significantly above the 6% neutral threshold. This shows that despite the recent $1,000 dip, professional traders are still confident in Ether’s price potential.
Spot volume remains strong
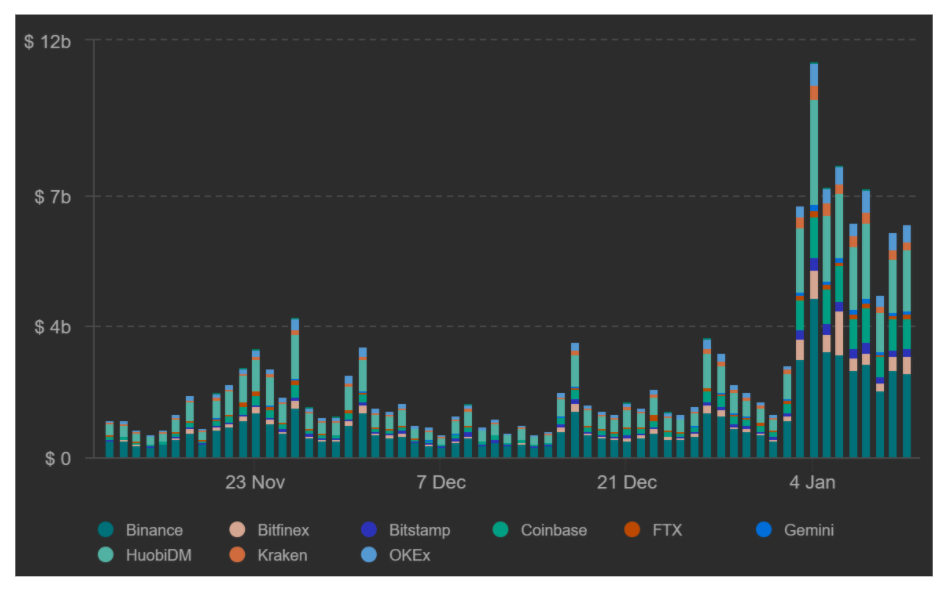
In addition to monitoring futures contracts, profitable traders also track volume in the spot market. Typically, low volumes indicate a lack of confidence. Therefore, significant price changes should be accompanied by robust trading activity.

Last week, Ether averaged an impressive $6.7 billion in trading volume, a noticeable increase from the levels seen in previous weeks. Despite the current drop, trading activity surrounding the recent price peak is a positive indicator.
Options put/call ratio
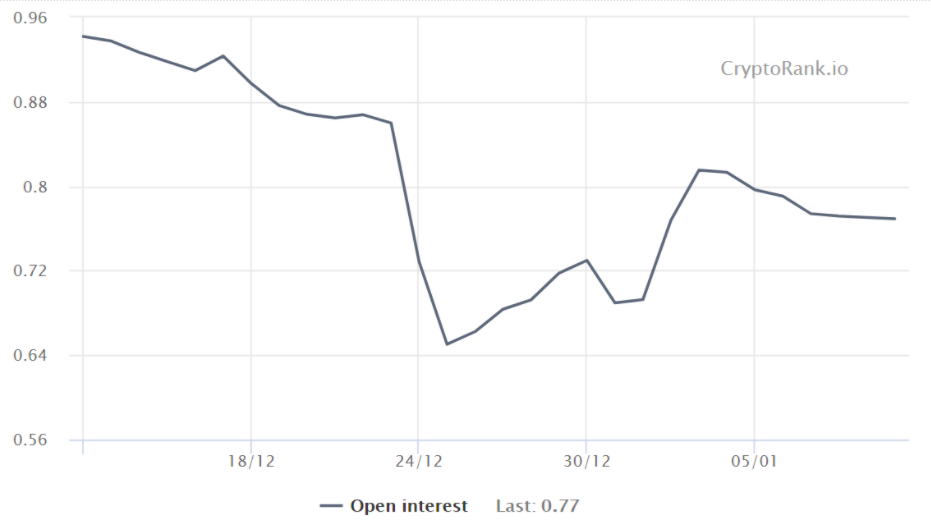
By measuring whether more activity is going through call (buy) options or put (sell) options, one can gauge the overall market sentiment. Generally speaking, call options are used for bullish strategies, whereas put options are used for bearish ones.
A 0.70 put-to-call ratio indicates that put options open interest lags the more bullish calls by 30% and is therefore bullish.

At the moment, there is no sign that investors have flipped to more neutral-to-bearish (put option) strategies, as the indicator stands at 0.77 and favors call options. This trend has also prevailed over the past week as investors continue to open new bullish positions.
This data is very encouraging, considering that Ether rallied 38% from Jan. 4 until reaching its $1,350 peak. Nevertheless, it is essential to monitor how today’s sharp correction will affect these bullish signs in the future.
Like Bitcoin (BTC), Ether continues to show positive fundamentals, even during the current sell-off, and this suggests that there is a good chance that the uptrend has not been broken.
The views and opinions expressed here are solely those of the author and do not necessarily reflect the views of Cryptox. Every investment and trading move involves risk. You should conduct your own research when making a decision.


