

Ethereum price is struggling to clear the $2,300 resistance zone. ETH is showing a few bearish signs and might decline toward the $2,080 support.
- Ethereum is still struggling to clear the $2,280 and $2,300 resistance levels.
- The price is trading below $2,260 and the 100-hourly Simple Moving Average.
- There is a connecting bearish trend line forming with resistance near $2,240 on the hourly chart of ETH/USD (data feed via Kraken).
- The pair could extend its decline if it stays below the $2,300 resistance zone.
Ethereum Price Faces Major Hurdle
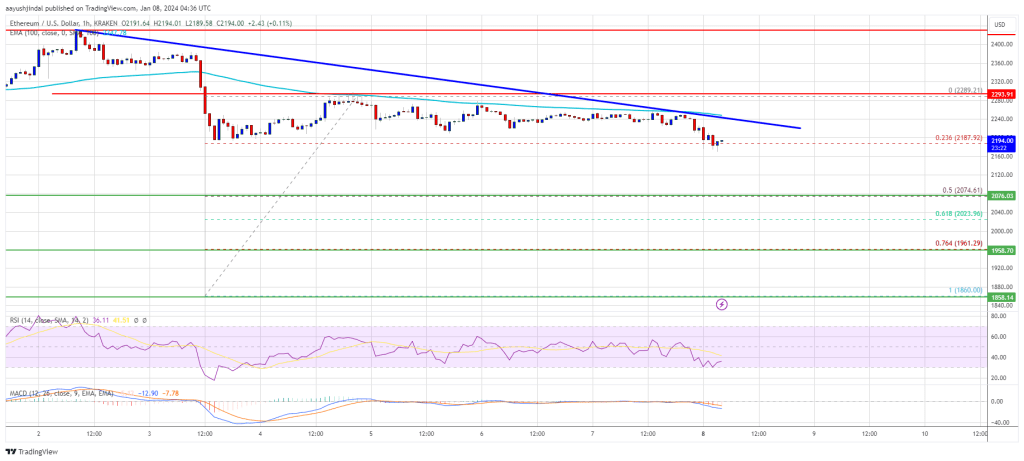
Ethereum price attempted a fresh increase above the $2,200 level, like Bitcoin. ETH climbed above the $2,250 and $2,260 levels. However, the bears were active near $2,300 and the 100-hourly Simple Moving Average.
A high was formed near $2,289 and the price recently saw a bearish reaction. There was a move below the $2,250 level. The price traded below the 23.6% Fib retracement level of the upward wave from the $1,860 swing low to the $2,289 high.
Ethereum is now trading below $2,260 and the 100-hourly Simple Moving Average. There is also a connecting bearish trend line forming with resistance near $2,240 on the hourly chart of ETH/USD.
If there is a fresh increase, the price might face resistance near the $2,250 level and the trend line. The first major resistance is now near $2,280. The next major hurdle sits at $2,300.
Source: ETHUSD on TradingView.com
A close above the $2,300 resistance could start a decent upward move. The next key resistance is near $2,400. If the bulls push Ethereum above $2,400, there could be a rally toward $2,500. Any more gains might send the price toward the $2,620 zone.
More Losses in ETH?
If Ethereum fails to clear the $2,250 resistance, it could start a fresh decline. Initial support on the downside is near the $2,120 level.
The first key support could be the $2,080 zone or the 50% Fib retracement level of the upward wave from the $1,860 swing low to the $2,289 high. A downside break and a close below $2,080 might spark strong bearish moves. In the stated case, Ether could test the $2,020 support. Any more losses might send the price toward the $1,960 level.
Technical Indicators
Hourly MACD – The MACD for ETH/USD is gaining momentum in the bearish zone.
Hourly RSI – The RSI for ETH/USD is now below the 50 level.
Major Support Level – $2,080
Major Resistance Level – $2,280
Disclaimer: The article is provided for educational purposes only. It does not represent the opinions of NewsBTC on whether to buy, sell or hold any investments and naturally investing carries risks. You are advised to conduct your own research before making any investment decisions. Use information provided on this website entirely at your own risk.

 Surges 7% as Stability Fees Introduced, DeFi Regains Footing")
