

Ethereum was trading in a positive area this Wednesday after rising about 5 percent on a 24-hour adjusted timeframe.
The second-largest cryptocurrency settled a new intraday high at circa $286, becoming one of the top-performing assets in the wake of a market-wide upside recovery. At its lowest, Ethereum was trading at $256 earlier this week, according to data fetched from US crypto exchange Coinbase.
The asset’s move uphill prompted traders to expect an extended bullish momentum. Prominent analyst Nico wrote in an analysis published earlier today that the Ethereum price could push towards $300 in the coming sessions, citing the level’s relevance during the 2019 bull run.
Crossed over ~275$ on quite straight up movement since mid january w/ increasing volume (levels back to ’19 bullrun that lead to $300 mark😏)
Looking here for a potential retest & R/S flip as entry & signal confirmation of a new leg up w/ target at $300+#ETH pic.twitter.com/FrOqdB6cYS
— Nico (@CryptoNTez) February 19, 2020
The jump also led market expert Alex Krüger to say that traders are actively accumulating Ethereum tokens over the past week. The economist noted that the crypto’s average trading volume in the past seven days was four times larger than that recorded in the second half of 2019, adding:
“Somebody has been buying a lot of ETH.”
Double Top
Ethereum’s jump to $286 also led to the possibilities of a Double Top formation. It is an extremely bearish technical reversal pattern that occurs when an asset reaches a local top two consecutive times with minor declines in between. So it appears, Ethereum’s price action this week was somewhat similar.
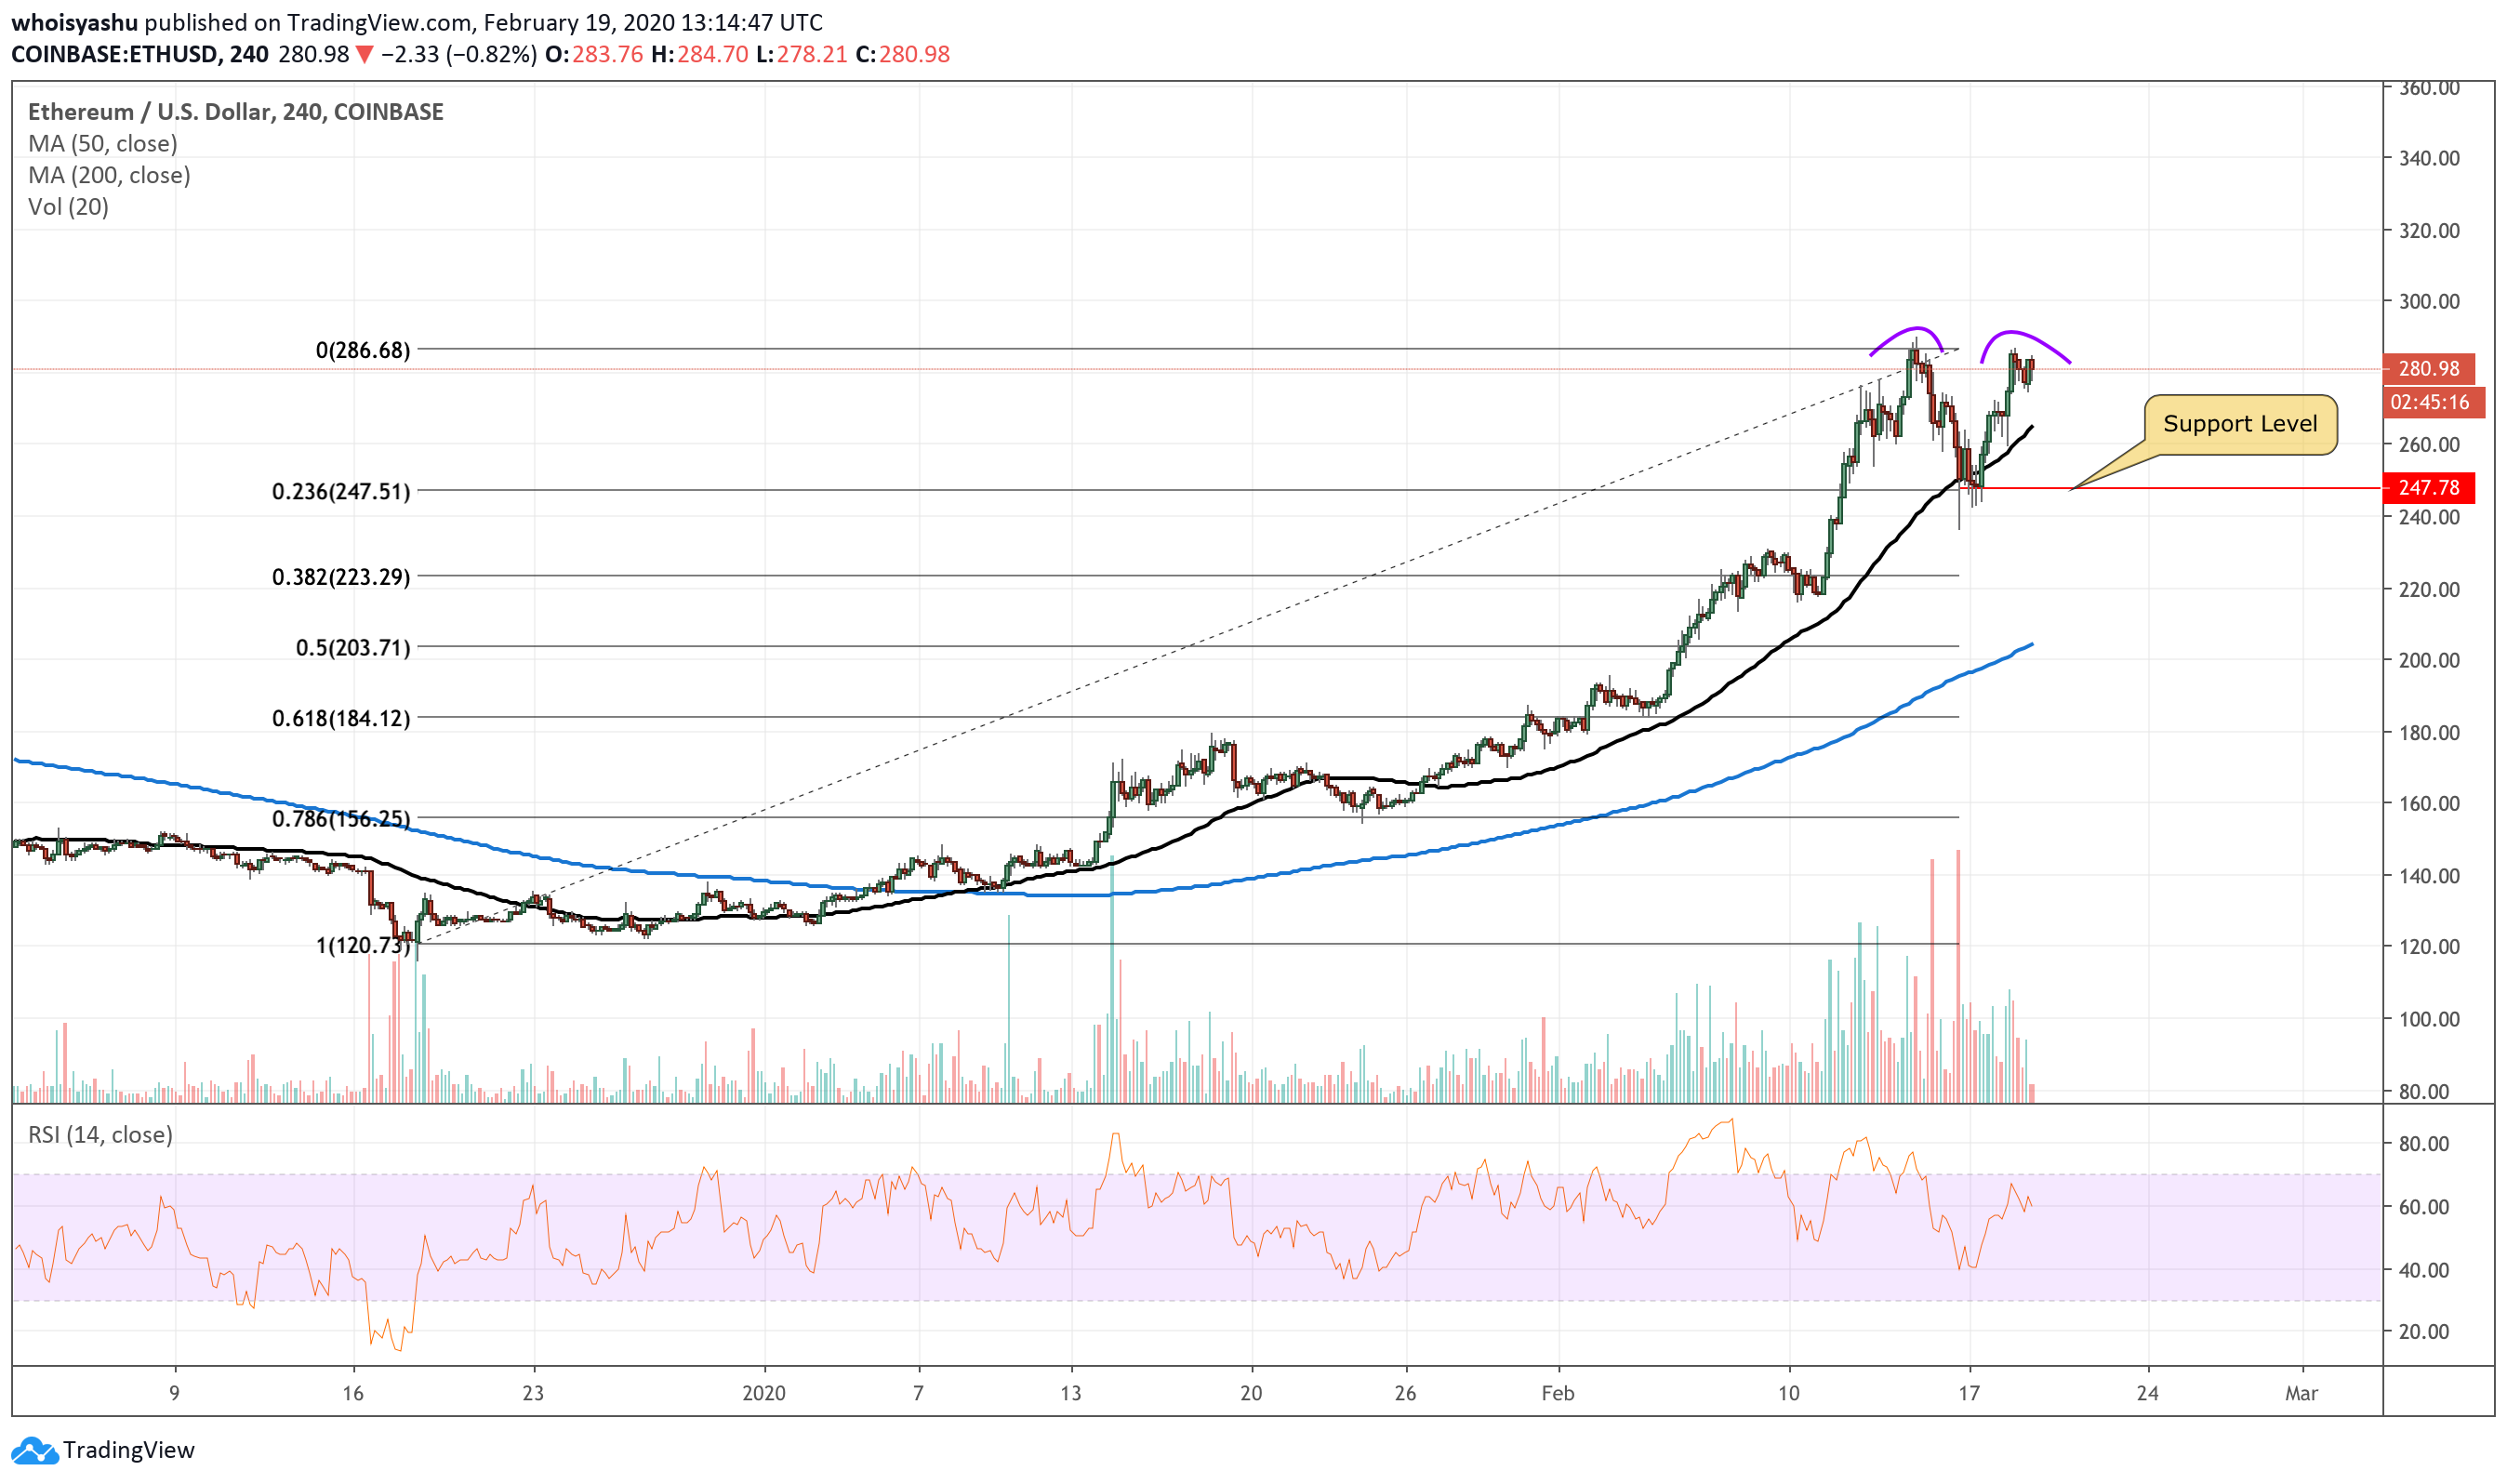
Double top brewing on Ethereum charts | Source: TradingView.com, Coinbase
The two purpled curves as shown in the chart above are two consecutive tops. Based on textbook definitions, Ethereum is now testing $247 as its next support. A double top pattern eyes validation only if the crypto’s price breaks below the said downside target. Should it happen, the pressure to maintain the upside bias will fall on the new support range of $203-233.
So far, a Double Top formation typically has led to bullish reversals in traditional financial instruments, which include stocks of Amazon and Netflix, as well as Gold and Oil.
Ethereum 1D Chart
The interim drop could still sustain Ethereum’s medium-term bias – which is bullish. The crypto is up by more than 140 percent after it bottomed out near $118 in December last year, which is likely to continue owing to the booming DeFi craze.

Higher chance for consolidation before the next move up | Source: TradingView.com, Coinbase
Even then, the crypto could consolidate in the redded rectangle area before it gathers breath to continue another bull run. That said, a fall towards $250 would follow a bounce back towards $288 which, in turn, could have traders target $334 as their primary upside target.
Conversely, breaking below the ascending support trendline (in green) could spell troubles for bulls. Should that happen, Ethereum could fall towards $200.


