

Ethereum price is correcting gains from the $2,350 resistance zone. ETH could start a fresh increase if it stays above the $2,200 support zone.
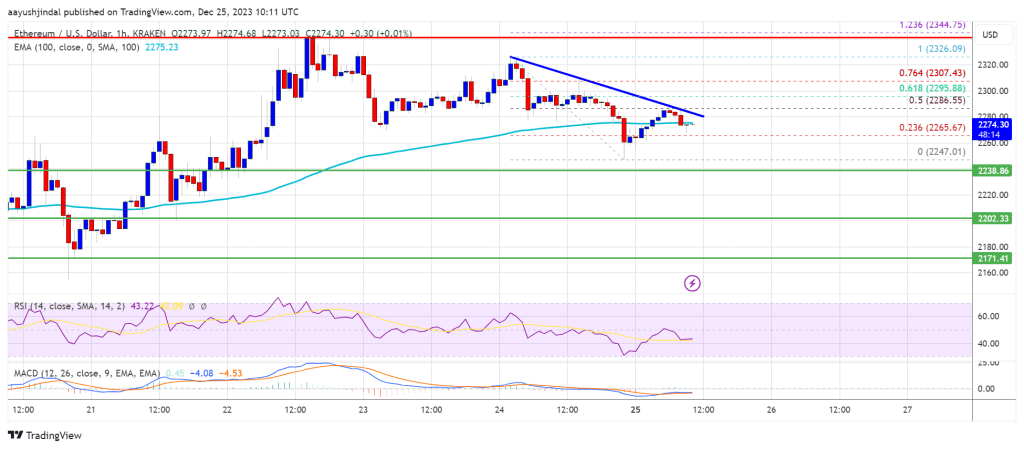
- Ethereum started a downside correction from the $2,350 resistance zone.
- The price is trading near $2,275 and the 100-hourly Simple Moving Average.
- There is a key bearish trend line forming with resistance near $2,285 on the hourly chart of ETH/USD (data feed via Kraken).
- The pair could attempt a fresh increase unless there is a close below $2,200.
Ethereum Price Remains Supported
Ethereum price failed again to gain pace for a move above the $2,350 level. ETH formed a short-term near $2,350 and recently started a downside correction, like Bitcoin.
There was a move below the $2,320 and $2,300 levels. The price even spiked below $2,250. A low was formed near $2,247 and the price is now correcting higher. There was a move above the $2,265 level. The price climbed above the 23.6% Fib retracement level of the downward move from the $2,326 swing high to the $2,247 low.
Ethereum is now near $2,275 and the 100-hourly Simple Moving Average. On the upside, the price is facing resistance near the $2,285 level. There is also a key bearish trend line forming with resistance near $2,285 on the hourly chart of ETH/USD.
The trend line is close to the 50% Fib retracement level of the downward move from the $2,326 swing high to the $2,247 low. A close above the $2,285 resistance could send the price toward $2,350.
Source: ETHUSD on TradingView.com
A clear move above the $2,350 zone could start a major increase. The next resistance sits at $2,420. Any more gains could start a wave toward the $2,500 level, above which Ethereum might rally and test the $2,550 zone.
More Losses in ETH?
If Ethereum fails to clear the $2,285 resistance, it could continue to move down. Initial support on the downside is near the $2,220 level.
The first key support could be the $2,200 zone. A downside break and a close below $2,200 might send the price further lower. In the stated case, Ether could revisit the $2,170 support. Any more losses might send the price toward the $2,120 level in the coming sessions.
Technical Indicators
Hourly MACD – The MACD for ETH/USD is losing momentum in the bullish zone.
Hourly RSI – The RSI for ETH/USD is now below the 50 level.
Major Support Level – $2,200
Major Resistance Level – $2,285
Disclaimer: The article is provided for educational purposes only. It does not represent the opinions of NewsBTC on whether to buy, sell or hold any investments and naturally investing carries risks. You are advised to conduct your own research before making any investment decisions. Use information provided on this website entirely at your own risk.


