

Ethereum price is outperforming Bitcoin with a move above $3,000. ETH is showing bullish signs and might soon climb above the $3,200 resistance.
- Ethereum started a fresh increase above the $3,000 resistance zone.
- The price is trading above $3,050 and the 100-hourly Simple Moving Average.
- There is a key bullish trend line forming with support at $3,080 on the hourly chart of ETH/USD (data feed via Kraken).
- The pair could extend its increase toward $3,200 or even $3,250 in the near term.
Ethereum Price Outperforms Bitcoin
Ethereum price remained stable above the $2,880 support zone. ETH formed a base and started a fresh increase above the $3,000 resistance. It gained nearly 5% and outperformed Bitcoin.
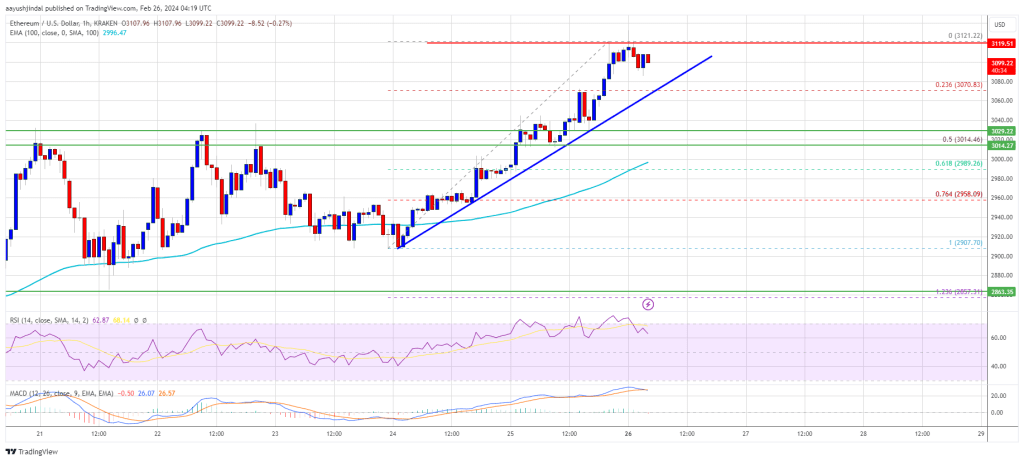
A new multi-week high is formed near $3,121 and the price is now consolidating gains. It is trading above the 23.6% Fib retracement level of the upward wave from the $2,907 swing low to the $3,121 high. There is also a key bullish trend line forming with support at $3,080 on the hourly chart of ETH/USD.
Ethereum is now trading above $3,085 and the 100-hourly Simple Moving Average. Immediate resistance on the upside is near the $3,120 level. The first major resistance is near the $3,150 level.
Source: ETHUSD on TradingView.com
The next major resistance is near $3,200, above which the price might gain bullish momentum. If there is a move above the $3,200 resistance, Ether could even rally toward the $3,280 resistance. Any more gains might call for a test of $3,320.
Are Dips Supported In ETH?
If Ethereum fails to clear the $3,120 resistance, it could start a downside correction. Initial support on the downside is near the $3,080 level and the trend line.
The first major support is near the $3,000 zone. It is close to the 50% Fib retracement level of the upward wave from the $2,907 swing low to the $3,121 high, below which Ether might test the 100-hourly Simple Moving Average. The next key support could be the $2,960 zone. A clear move below the $2,960 support might send the price toward $2,920. Any more losses might send the price toward the $2,860 level.
Technical Indicators
Hourly MACD – The MACD for ETH/USD is losing momentum in the bullish zone.
Hourly RSI – The RSI for ETH/USD is now above the 50 level.
Major Support Level – $3,000
Major Resistance Level – $3,120
Disclaimer: The article is provided for educational purposes only. It does not represent the opinions of NewsBTC on whether to buy, sell or hold any investments and naturally investing carries risks. You are advised to conduct your own research before making any investment decisions. Use information provided on this website entirely at your own risk.


